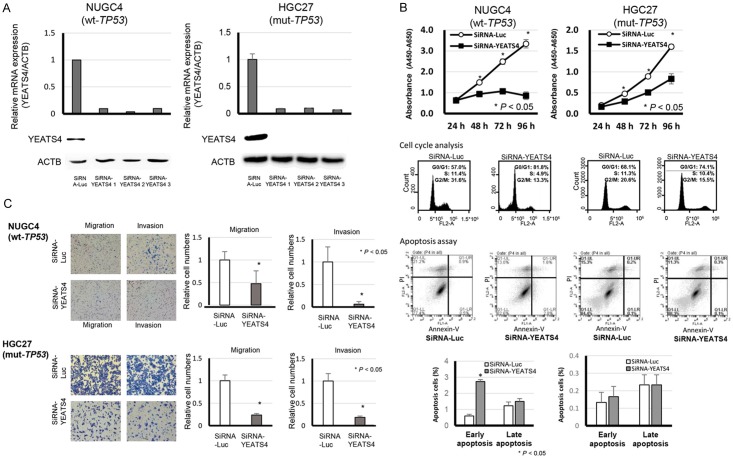
Figure 2.
Suppression of malignant behaviors in GC cells by knockdown of YEATS4 and the knockdown effect according to TP53 mutation status. A. Effects of YEATS4 knockdown by siRNA (siRNA-YEATS4) compared with those of the control siRNA in NUGC4 (wild-type TP53) and HGC27 (mutant-type TP53) cell lines. B. Effects of knocking down endogenous YEATS4 on cell proliferation at the indicated times. The results are the means ± SD (bars) for quadruplicate experiments. The Mann-Whitney U-test was used for the statistical analysis: *P < 0.05. Representative results of the population in each phase of the cell cycle in GC cells assessed by FACS at 72 h after treatment with siRNA (upper middle). Representative results of the apoptosis assay in GC cells at 72 h after treatment with siRNA (lower middle). C. Migration and invasion of cells transfected with siRNA targeting YEATS4 in NUGC4 and HGC27. The graphs on the bottom show the means ± SD (bars) of n = 4. The Mann-Whitney U-test test was used for statistical analysis. P < 0.05 was considered statistically significant.

