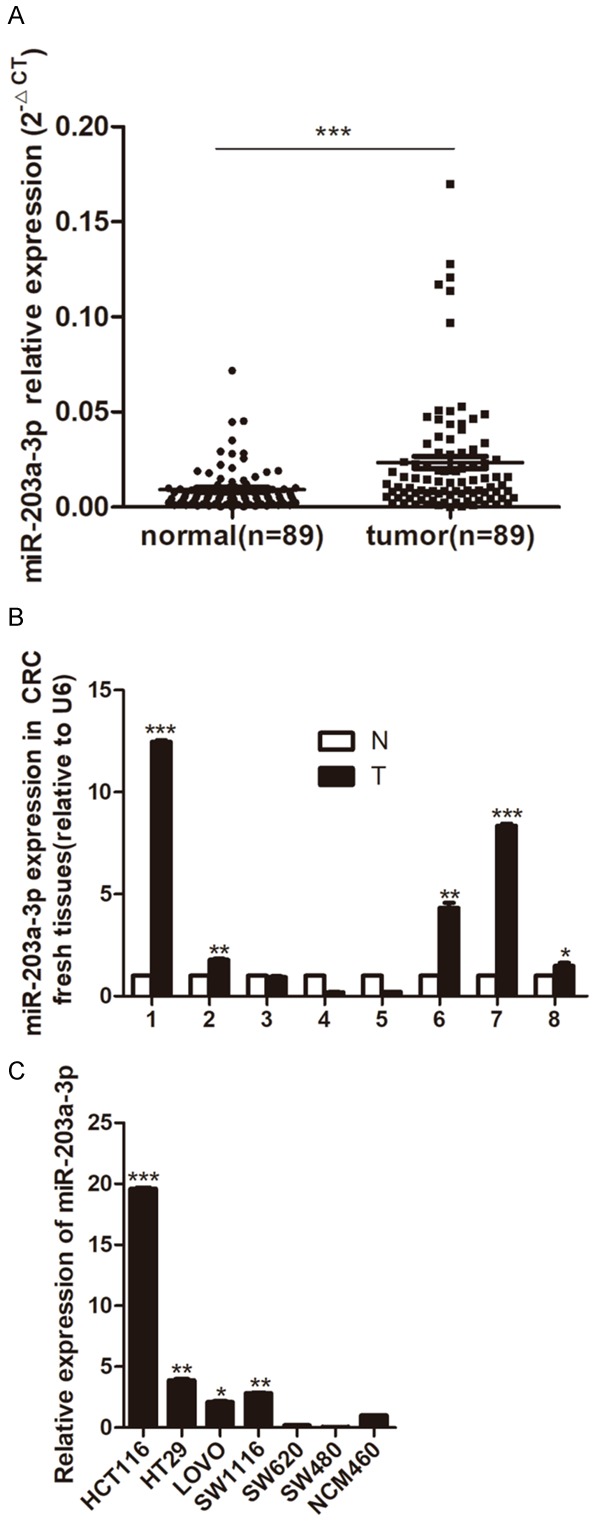
Figure 1.

miR-203a-3p expression in CRC tissues and cell lines. A. miR-203a-3p expression level in 89 paired of Paraffin CRC tissues (tumor) and adjacent non-tumor colorectal mucosa tissues (normal) by quantitative real-time PCR analysis. B. miR-203a-3p expression level in 8 paired of fresh CRC samples (T) and adjacent non-tumor colorectal mucosa tissues (N). C. miR-203a-3p expression level in CRC cell lines. Data were normalized to the miR-203a-3p expression level in NCM460 cells. qPCR data represent mean ± SD of three independent experiments. *P < 0.05; **P < 0.01; ***P < 0.001.
