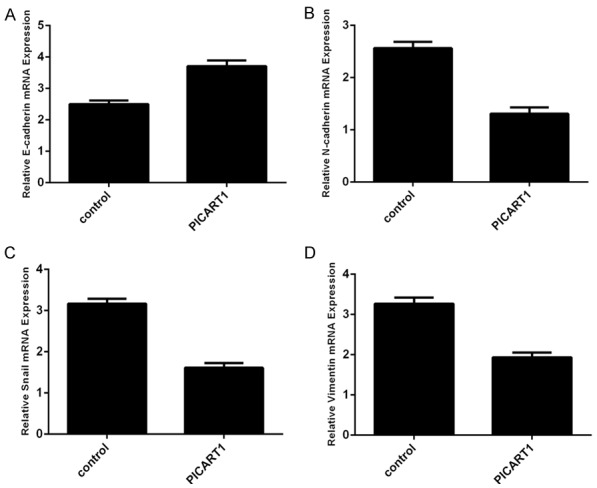
Figure 4.

Overexpression of PICART1 suppressed epithelial-mesenchymal transition (EMT) progression. A. The expression of E-cadherin was measured by qRT-PCR. Ectopic expression of PICART1 enhanced the E-cadherin expression in the A549 cell. B. Ovexpression of PICART1 decreased the N-cadherin expression in the A549 cell. C. Elevated expression of PICART1 suppressed the Snail expression in the A549 cell. D. The expression of Vimentin was determined by qRT-PCR.
