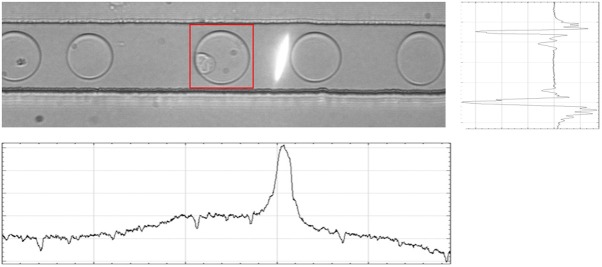
Figure 2.
Picture of a droplet flowing in the microfluidic channel. The white laser slit is visible next to the drop of interest, which is surrounded by a red square, indicating the crop applied to the droplet. Below the image, the vertical projection of intensity is shown, which has a peak corresponding to the laser beam. At the right, the horizontal projection of the same image is shown. The two minima values corresponding to the walls of the capillary.

