
Figure 4.
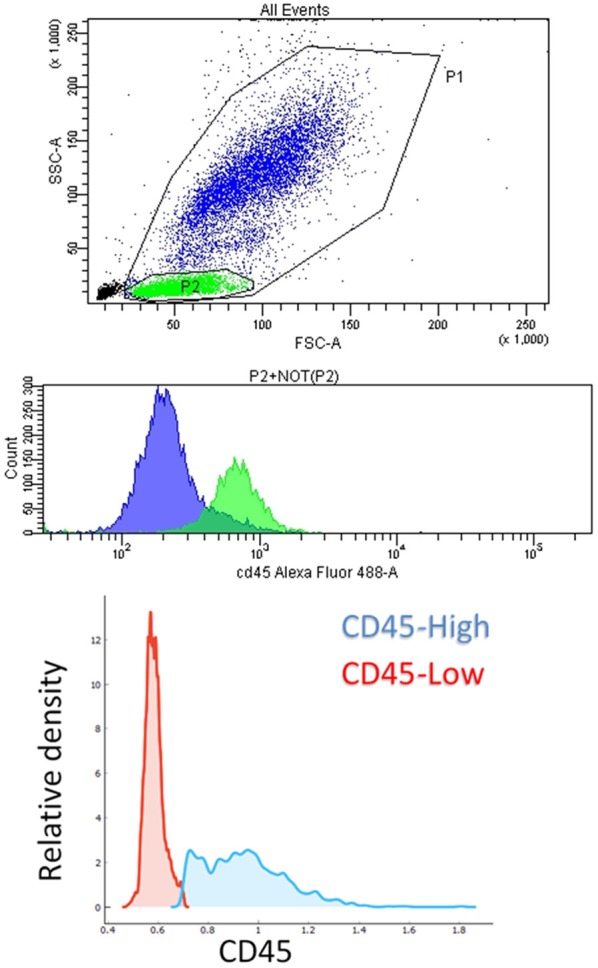
Flow cytometry. Top: dot-plot of a typical healthy blood lysate obtained with flow cytometry, in which P1 population (WBC), P2 (lymphocytes) in green, and NOT(P2) (granulocytes and monocytes) in blue, are visible. Middle: histogram of fluorescence intensity corresponding to CD45 expression for the descripted populations. Bottom: relative density of cell populations with high- and low-CD45 expression in a healthy sample.