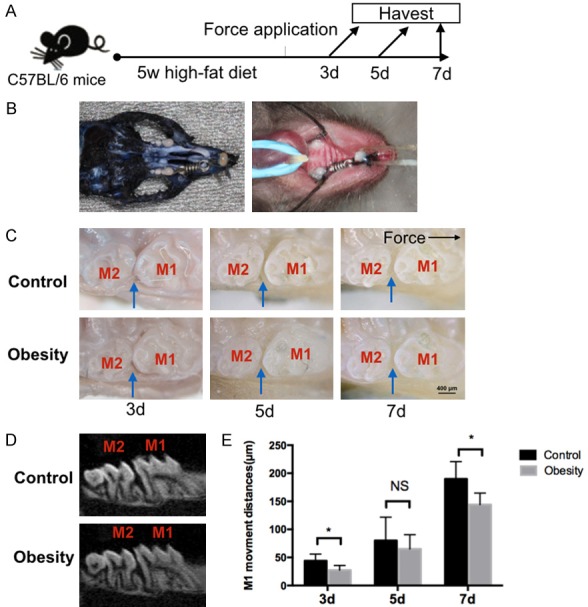
Figure 1.

Obesity and orthodontic tooth movement models in mice were established. A. Schedule of the experiment. After 5 weeks of high-fat diet, orthodontic force was applied to mice. Mice were sacrificed at 3 day, 5 day and 7 day after force application. B. The orthodontic tooth movement model in mice. The maxillary left first molars were moved mesially by closed-coil springs. C. Representative intra-oral photograph of tooth movement model in obese and control mice after 3 days, 5 days and 7 days of force application. D. MicroCT representative image of tooth movement model in obese and control mice after 7 days of force application. E. Amount of orthodontic tooth movement on 3 day, 5 day and 7 day after force application in obese and control mice. The black arrow indicated direction of tooth movement. The blue arrows indicated tooth movement distances, M1: first molar. M2: second molar; n=5 in each group, error bars, means ± SD; scale bar: 400 μm; *P<0.05; NS: not statistically significant.
