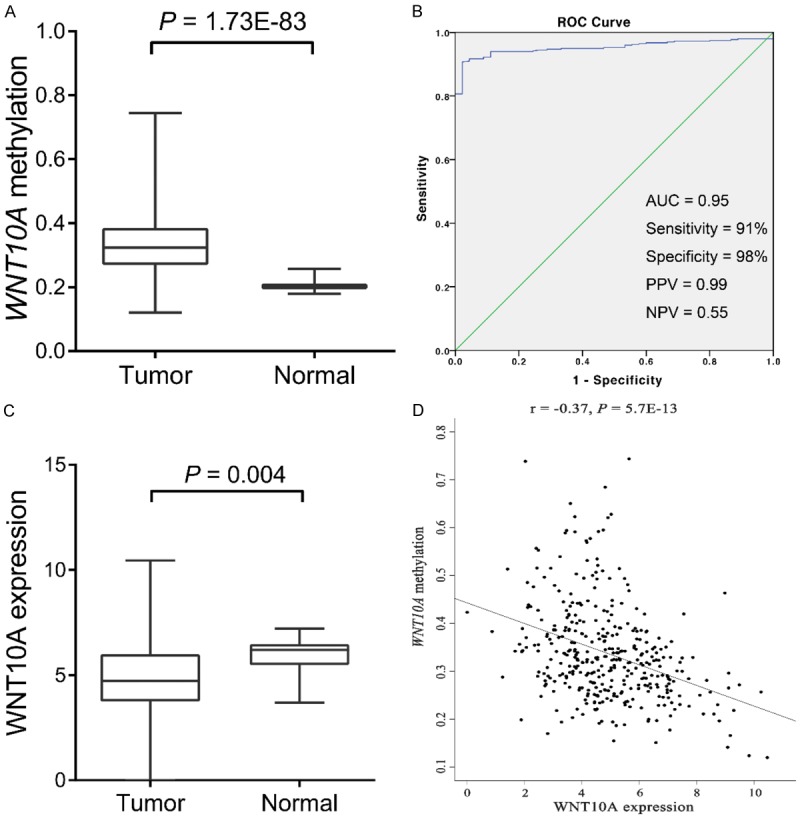
Figure 4.

Validation of WNT10A methylation from TCGA dataset. A: Comparison of WNT10A methylation between patients with CRC and controls in TCGA cohorts. B: Diagnostic power of methylated WNT10A in distinguishing of patients with CRC from controls in TCGA cohorts. C: Comparison of WNT10A expression between patients with CRC and controls from TCGA portal. D: Negative correlation of WNT10A methylation and expression from TCGA portal.
