Figure 1.
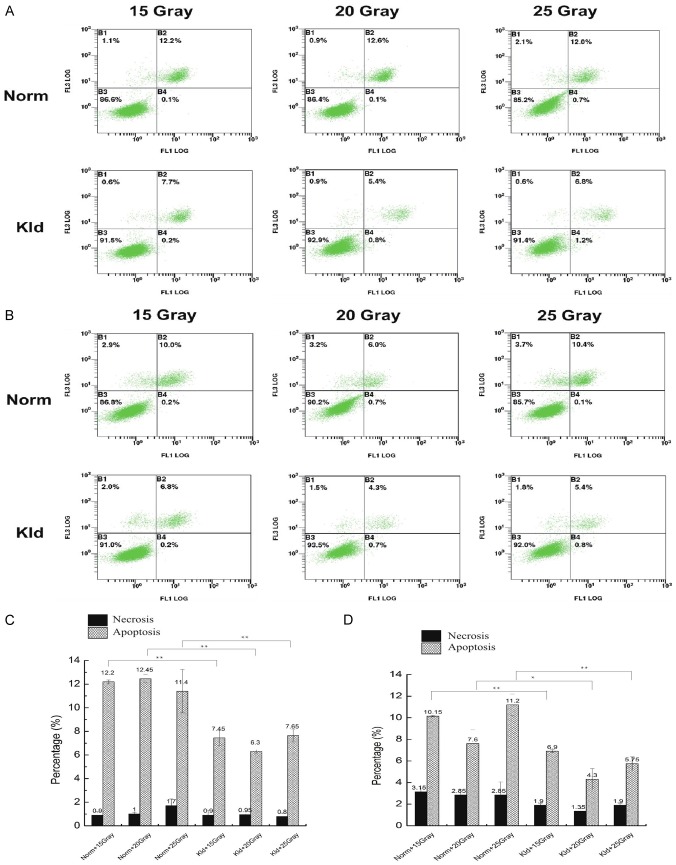
Keloid fibroblasts have stronger resistance at 24 hrs and 48 hrs post-IR treatment. The y-axis indicates propidium iodide (PI) staining, and the x-axis shows Annexin V-FITC staining. The upper left quadrant represents necrosis, the upper right shows late apoptosis, and the lower right shows early apoptosis. A. Annexin V flow cytometry analysis at 24 hrs post-IR treatment. B. Annexin V flow cytometry analysis at 48 hrs post-IR treatment. C. The percentage of necrosis and apoptosis at 24 hrs post-IR treatment. No significant difference in the percentage of necrosis was observed between normal fibroblasts and keloid fibroblasts. D. The percentage of necrosis and apoptosis at 24 hrs post-IR treatment. At different doses, the keloid group exhibited a consistently lower degree of apoptosis suggesting keloid maintained resistance to radiation. (*, P<0.05; **, P<0.01).

