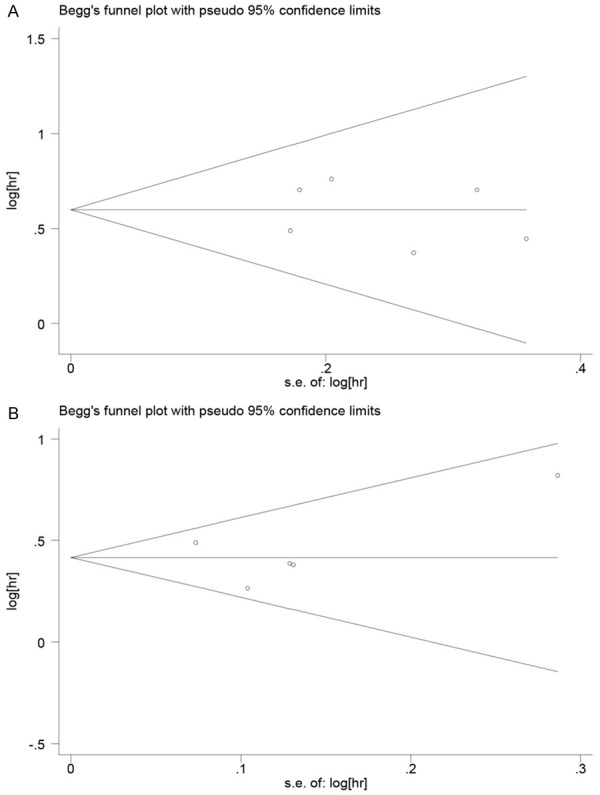
Figure 6.

Funnel plots of anemia with mCRPC. A: Funnel plots of association between anemia and mCRPC OS among retrospective studies after sensitivity analysis; B: Funnel plots of association between anemia and mCRPC OS among prognostic studies. Hr: hazard ratio; SE, standard error; One cycle represents one individual study.
