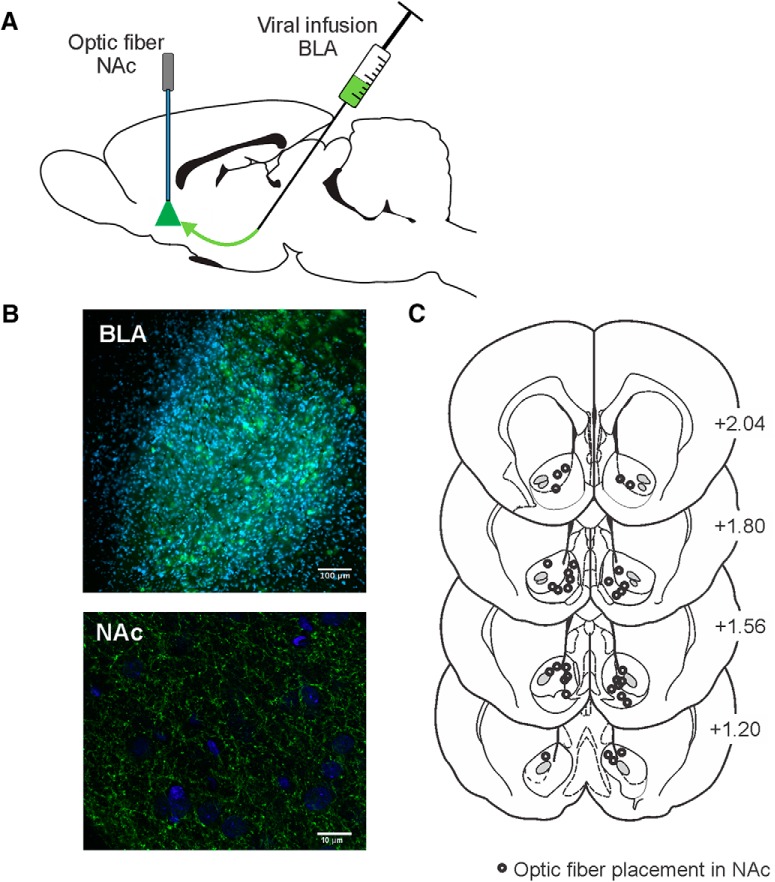
Figure 1.
Optogenetic design, histology, and fiber placements for the behavioral experiments. A, Viral infusions were made into BLA, and laser light via optic fibers was delivered to NAc to suppress activity in BLA terminal inputs. B, top panel, Representative slice at 10× of BLA expression within the BLA (blue is DAPI; green is eYFP). Bottom panel, Representative slice at 63× of BLA terminal expression in NAc (blue is DAPI; green is GFP). C, Location of fiber optic placements in NAc. Numbers correspond to mm from bregma.

