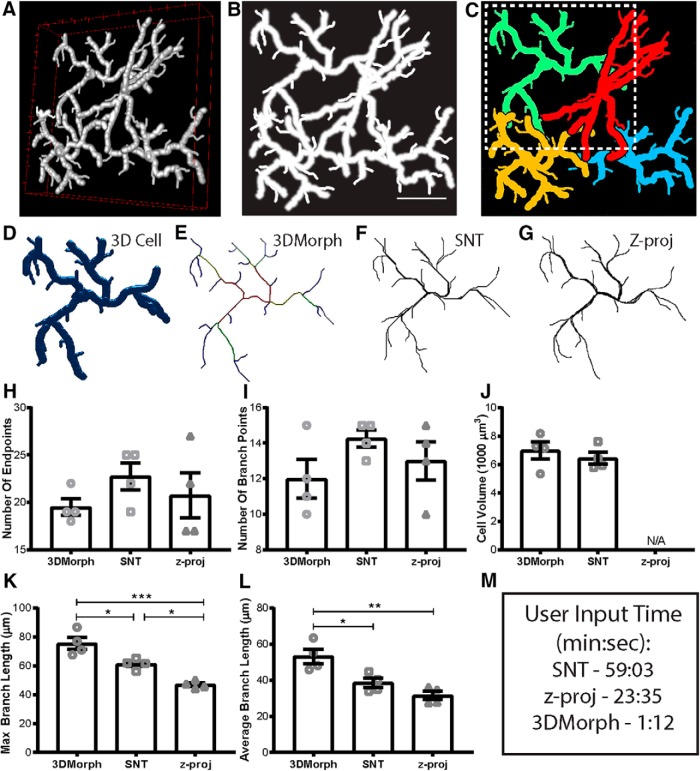
Figure 4.
Validation and comparison of 3DMorph with current analysis tools. A, 3D visualization of a manually-generated test image composed of four cells with overlapping processes. B, Z-projection of test image. Scale bar, 25 µm. C, Full cells as identified by 3DMorph. D, A single full cell from the test image (outlined by dashed box in C). E, 3D skeleton generated automatically by 3DMorph. F, 3D skeleton manually drawn using Simple Neurite Tracer (SNT). G, 2D skeleton manually drawn using freehand tracing of a z-projection of the test image. Based on analysis by 3DMorph, SNT, or z-projection tracing, there is no significant difference in the number of endpoints (H) or branch points (I) recorded. J, Cell volume measurements are accurate between 3DMorph and SNT, but unavailable from z-projection analysis. K, Maximum branch length is significantly longer by 3DMorph and SNT analysis than by z-projection tracing. L, Average branch lengths are significantly longer by 3DMorph than by SNT or z-projection. M, Comparison of user input time to measure data. Error bars indicate mean ± SEM. *p < 0.05, **p < 0.01, ***p < 0.001 by one-way ANOVA.

