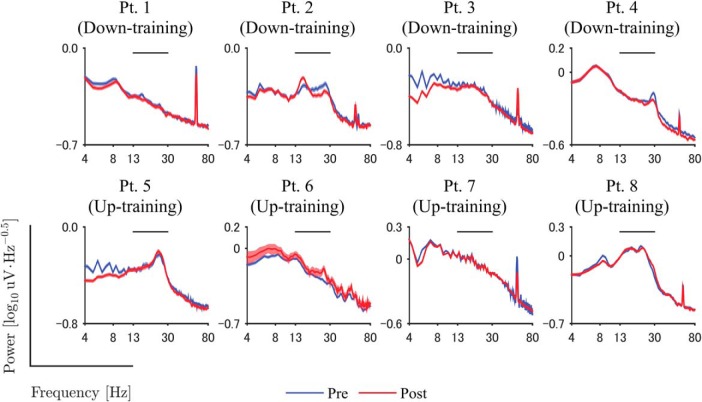
Figure 3.
Power spectra during pre- and post-feedback sessions. Blue and red lines denote the power spectrum of DBS signals during resting state before and after the feedback training, respectively. Shaded areas represent the estimated 95% confidence interval of the power spectrum among 1 s time windows. The horizontal line above the data curves shows the range of β-band used for feedback training. Frequency is shown on a log scale.

