Figure 4.

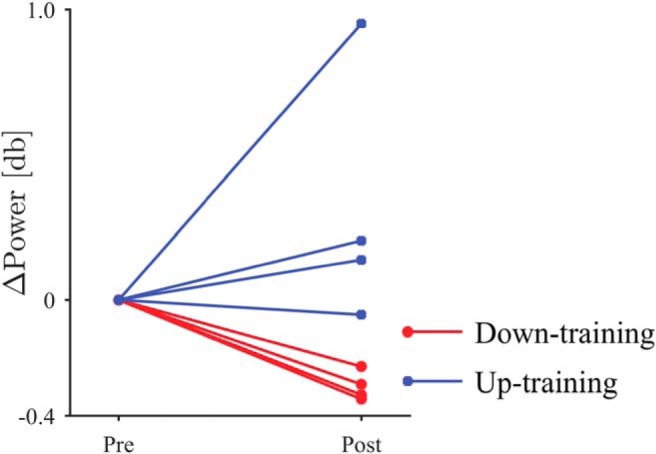
The difference in β-band power between the pre- and post-feedback sessions. The circular markers and red lines denote the down-training condition, whereas the square markers and blue lines indicate the up-training condition.

The difference in β-band power between the pre- and post-feedback sessions. The circular markers and red lines denote the down-training condition, whereas the square markers and blue lines indicate the up-training condition.