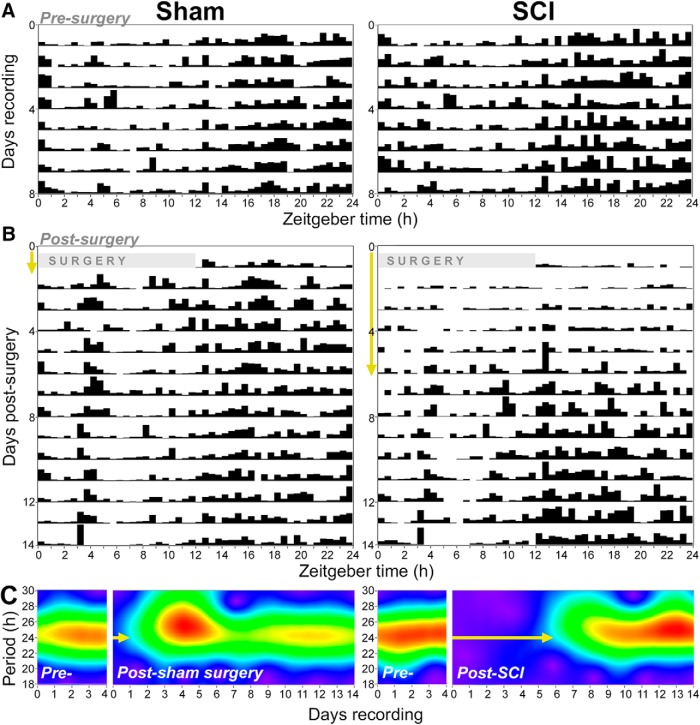
Figure 6.
Rats with SCI show delayed the recovery of diurnal activity rhythms. These representative data are from one male sham and one male SCI rat. A, B, Actograms display continuous measures of activity across the day (ZT; x-axis) and over time postsurgery (y-axis). A, Before surgery, these rats in the sham and SCI groups had expected diurnal patterns of activity (i.e., increased activity between ZT12 and ZT24; higher black bars). B, After surgery, sham rats quickly recover more typical activity rhythms, whereas SCI rats show delayed postsurgery recovery of rhythms. Yellow arrows highlight approximate latency to the recovery of 24 h rhythms; also shown in C. C, Wavelet analysis shows that before surgery rats display strong 24 h rhythms, and that sham and SCI rats have different postsurgery latencies to recover 24 h activity rhythms (yellow arrows). The sham rat recovered 24 h rhythms within ∼1 d postsurgery, whereas the SCI rat recovered 24 h rhythms at ∼6 d postsurgery. The intensity of rhythm across days is represented by the color continuum: purple (minimal rhythm) through blue and green to red (intense rhythm).

