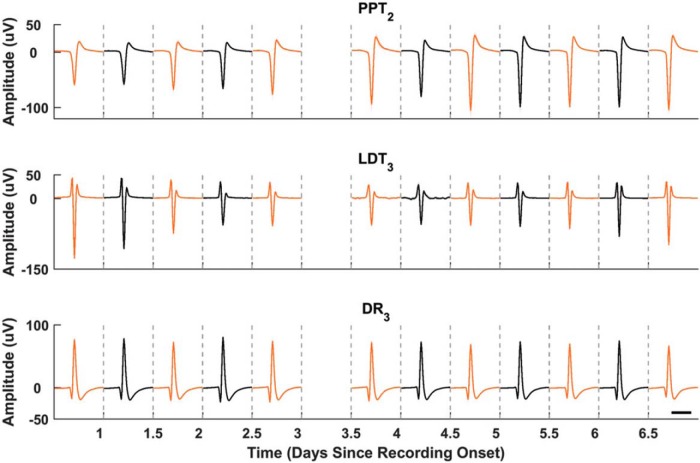
Figure 9.
Chronic single-unit stability. Extracellular action potentials recorded simultaneously from PPT, LDT, and DR over a continuous 7 d recording session. Waveforms were averaged over 12 h periods to correspond with light (black traces) and dark (orange traces) cycles, which were separated because of the change in time-of-day dependence of the firing rates. The x-axis is days starting from onset of recordings in a particular recording session. The number subscripts for each region represent the group electrode channel on which each unit was recorded. Data missing from part of day 3 were the result of a computer acquisition failure. Scale: 1 ms.

