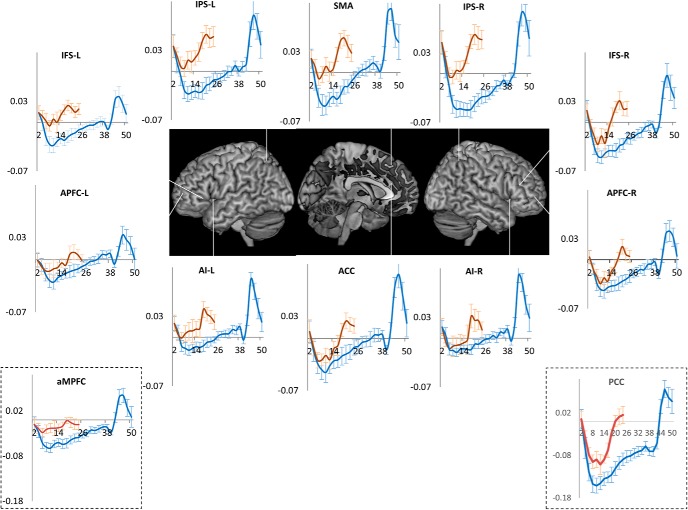
Figure 11.
Orange line plots the time course of activity across the 15- to 18-s-long trial episodes of experiment 2B, blue lines plot the activity time course across the 40-s-long trial episodes of experiment 2A. Note in experiment 2B nadir is shallower and activity returns to baseline by the 18th second, the expected time of completion.

