Figure 2.

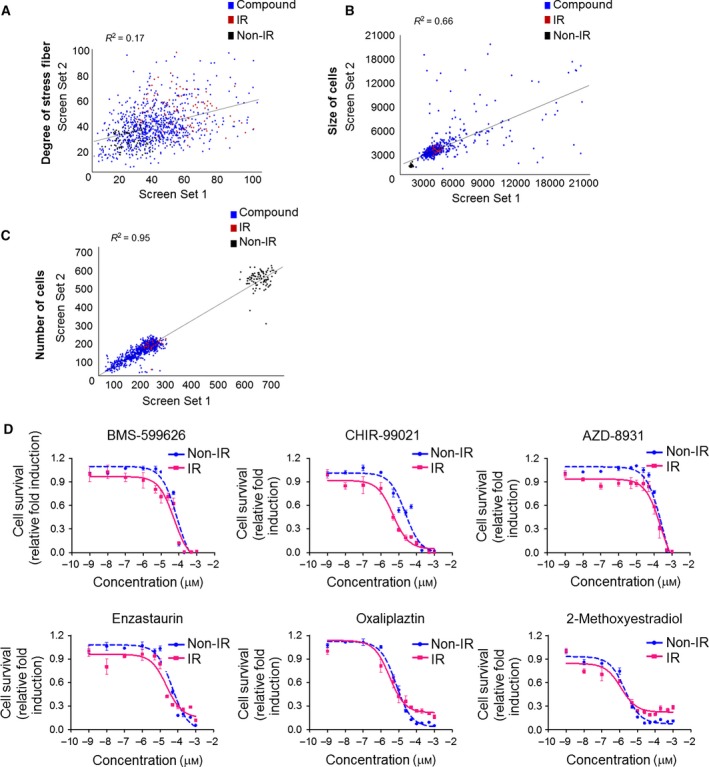
Phenomic screening results. Assay sensitivity was evaluated against a library containing 622 compounds screened in duplicate to assess reproducibility. (A) Scatter plot analysis shows the correlation of the degree of stress fiber in set 1 versus set 2. Each plot represents a single compound in the assay plate. (B) Scatter plot analysis of cell size and (C) cell number. (D) H1299 cells were irradiated with 10 Gy and treated with the six hit compounds at the indicated concentrations for 48 h at 3 h following irradiation. After incubation, cells were stained with Hoechst and analyzed with the Operetta system. Dose–response curve with cell survival of H1299 with or without radiation is shown.
