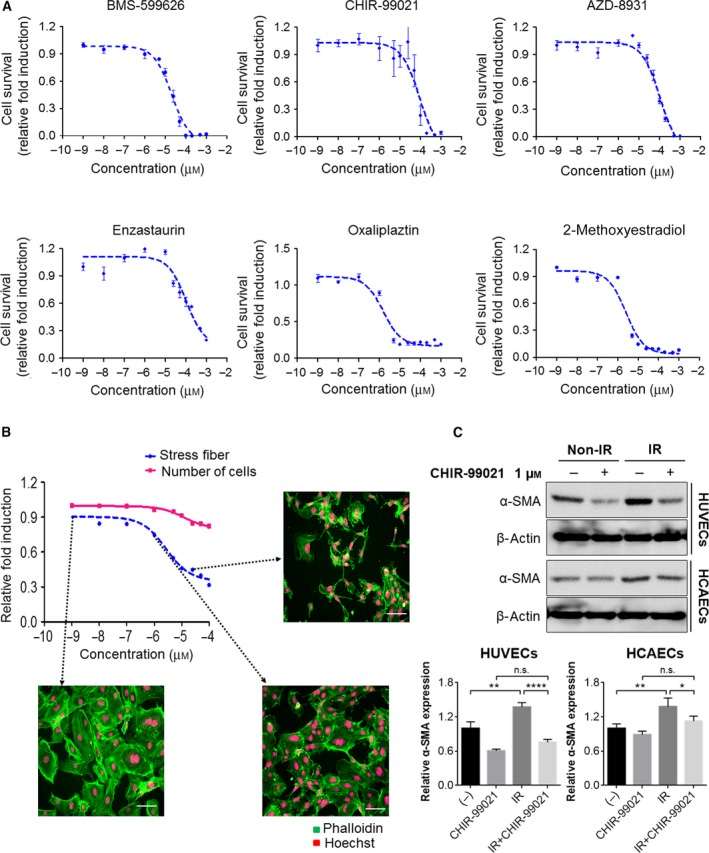
Figure 3.

Effects of CHIR‐99021 on HUVECs. (A) HUVECs were treated with the six hit compounds at the indicated concentrations. After a 48‐h incubation, cells were stained with Hoechst, and cell numbers were analyzed with the Operetta system. (B) HUVECs were treated with CHIR‐99021, which was the final hit compound, at the indicated concentrations for 48 h. After incubation, cells were stained with Phalloidin and Hoechst. Number of cells and stress fibers were analyzed with im software. Each image shows stress fibers in HUVECs. Scale bar = 200 μm. (C) HUVECs and HCAECs were pretreated with CHIR‐99021 at 1 h before radiation and irradiated with 10 Gy. After 24 h, cells were prepared for western blot analysis. Expression of α‐SMA (EndMT‐related protein) was examined in HUVECs and HCAECs. β‐actin was loaded for control. The band intensity was quantified and calculated relative to Non‐IR/CHIR‐99021 0 μm group (lower). Statistical analysis was performed using the Student's t‐test and n = 3. Each error bar represents mean ± SD (*P < 0.05, **P < 0.01, ****P < 0.0001, ns: not significant).
