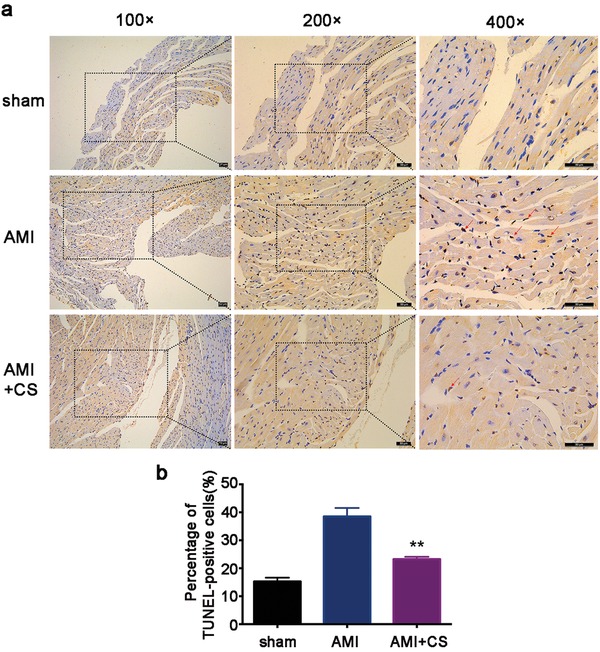
Figure 7.

Effect of “ion therapy” on cardiac apoptosis in vivo post‐AMI. a) Representative immunohistochemical pictures of TUNEL staining in border‐zone of infarction. Total nuclei (DAPI staining, blue) and TUNEL positive nuclei (brown‐yellow). Red arrows show TUNEL‐positive cardiomyocytes. Scale bar represents 50 µm. b) Quantitative analysis of TUNEL‐positive cardiomyocytes (10 pictures for each group). Sham group n = 4; AMI group n = 7 and AMI+CS group n = 13. **p < 0.01 versus AMI group; mean ± SD.
