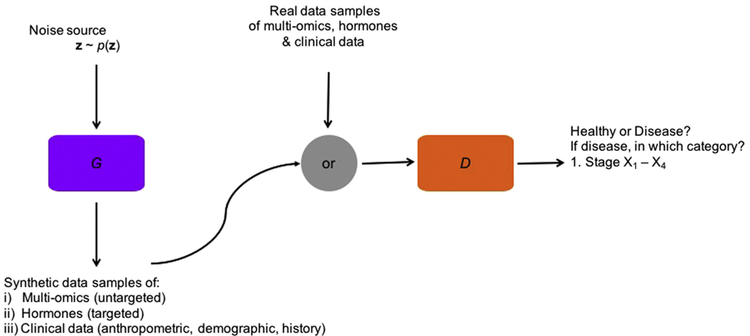
Fig. 1.
Visualization of CatGAN with the generator G (in purple) and the discriminative classifier D (in orange) neural networks: The generator creates synthetic data samples of multi-omics, specific hormones and clinical data (anthropometric, demographic or from medical history) from a noise source z. The classifier receives both “fake” and real (disease) data and aims to tell them apart. For a real data sample, the classifier also assigns it to the stage of the disease.

