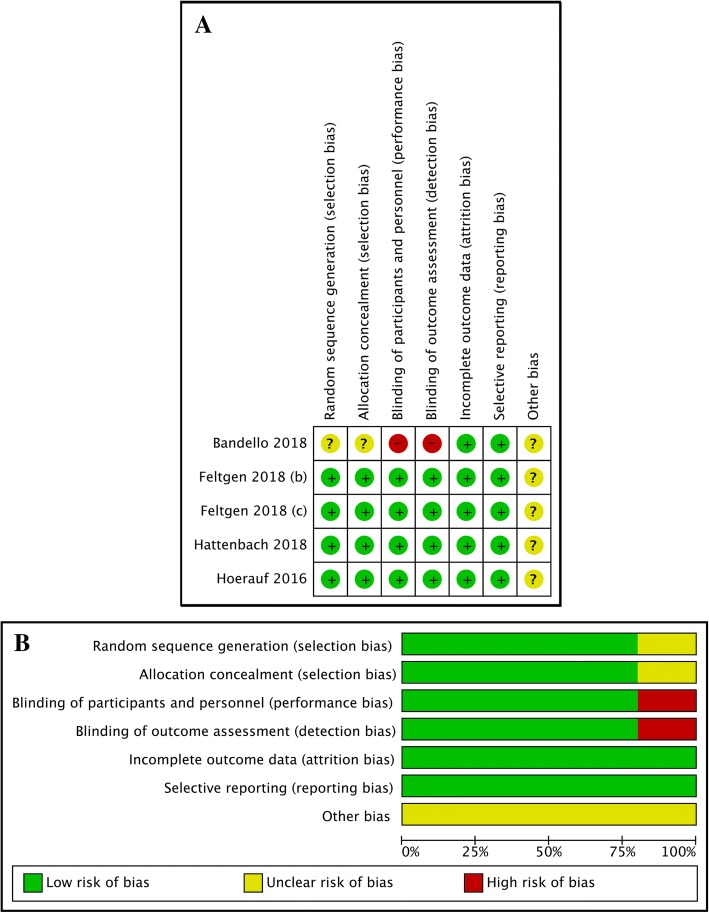
Fig. 2.
Assessment of the risk of bias in the included studies. a: Risk of bias summary: the authors’ judgements on each risk of bias item for the included studies. +: low risk of bias; −: high risk of bias; and?: unclear risk of bias. b: Risk of bias graph: authors’ judgements regarding each risk of bias item displayed as percentages across the included studies

