
Fig. 8.
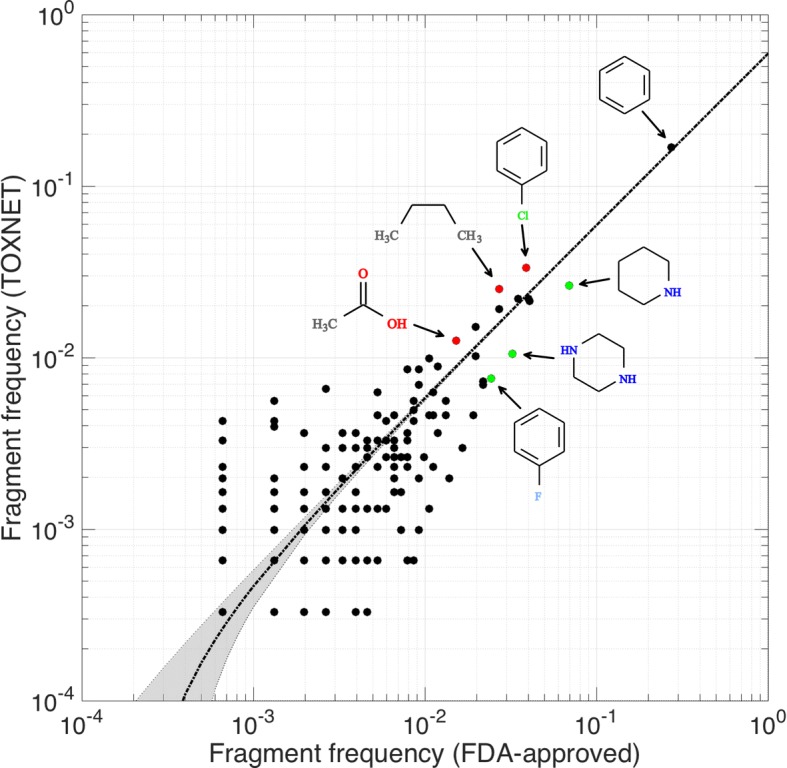
Composition of non-toxic and toxic compounds. The scatter plot compares the frequencies of chemical fragments extracted with eMolFrag from FDA-approved (non-toxic) and TOXNET (toxic) molecules. The regression line is dotted black and the gray area delineates the corresponding confidence intervals. Three selected examples of fragments more commonly found in FDA-approved molecules (piperidine, piperazine, and fluorophenyl) are colored in green, whereas three counter examples of fragments more frequent in the TOXNET dataset (chlorophenyl, n-butyl, and acetic acid) are colored in red