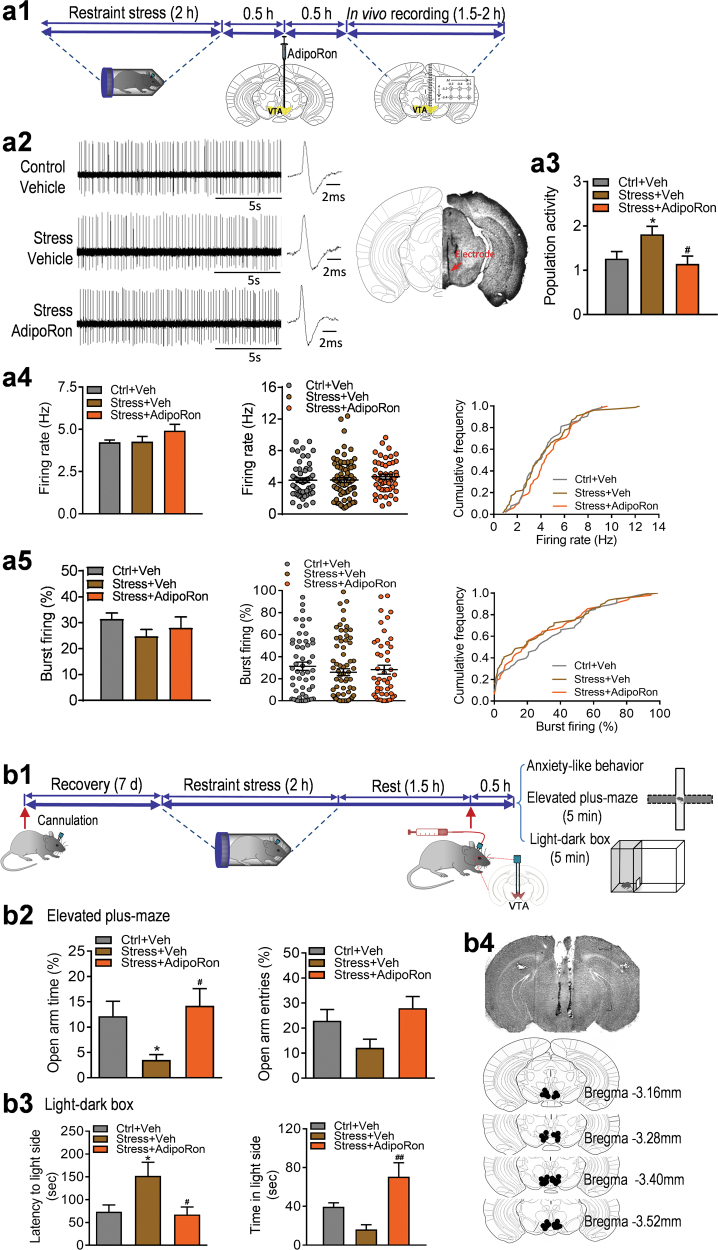
Fig. 2.
Effect of AdipoRon on acute restraint stress-induced effects on VTA dopamine neuron activity and anxiogenic-like response. (a1) Schematic timeline of acute restraint stress, intra-VTA microinjection and in vivo extracellular recordings. (a2) Left, representative extracellular voltage traces from dopamine neurons in the VTA; right, representative image demonstrating the electrode track through the VTA. (a3) Number of spontaneously active dopamine neurons per track through the VTA. (a4) Firing rate: bar graph (left), scatter plot (middle) and cumulative frequency distribution (right). (a5) Proportion of burst firing: bar graph (left), scatter plot (middle) and cumulative frequency distribution (right). Control + vehicle: n = 7 mice, 53 neurons; restraint stress + vehicle: n = 7 mice, 76 neurons; restraint stress + AdipoRon: n = 7 mice, 48 neurons. (b1) Schematic timeline of acute restraint and behavioral testing procedures. (b2) Elevated plus maze test. Left, percentage of open/total arm time. Right, percentage of open/total arm entries. Control + vehicle: n = 10 mice; restraint stress + vehicle: n = 10 mice; restraint stress + AdipoRon: n = 10 mice. (b3) Light–dark box test. Left, latency to enter the light side. Right, time spent in the light compartment. Control + vehicle: n = 8 mice; restraint stress + vehicle: n = 6 mice; restraint stress + AdipoRon: n = 8 mice. (b4) Representative image (upper) and schematic illustration of injection sites in the VTA (lower). *P < 0.05 compared with the non-stressed, vehicle-treated group. #P < 0.05, ##P < 0.01 compared with the stressed, vehicle-treated group

