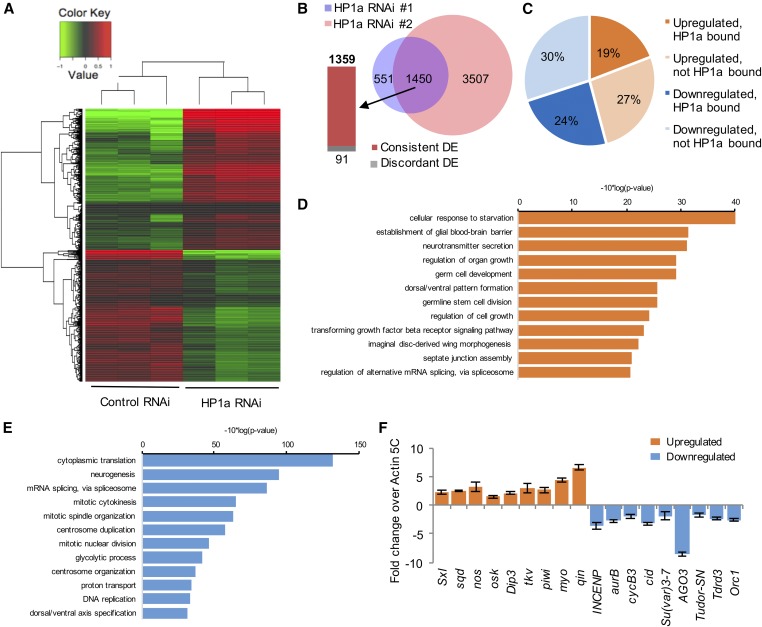
Figure 5.
Bioinformatic analyses of genes differentially expressed upon reducing HP1a expression. (A) A heatmap representing clusters of differentially expressed genes in control and HP1a RNAi lines. (B) In both HP1a RNAi lines, 1450 genes are differentially expressed, among which 1359 genes are consistently DE and 91 genes display an opposite change trend (discordant DE). Of these, 551 genes are differentially expressed and specific to RNAi #1, while 3507 are differentially expressed and specific to RNAi #2. (C) Out of 1359 DE genes that show consistent trends in both HP1a RNAi lines, 19% were upregulated and bound by HP1a, 27% were upregulated but not bound by HP1a, 24% were downregulated and bound by HP1a, and 30% were downregulated but not bound by HP1a, i.e., 43.3% of DE genes were bound by HP1a. (D and E) GO analyses of maternal transcripts differentially expressed upon reducing HP1a expression. (D) GO analysis for upregulated maternal transcripts. Top 12 terms in biological functions with P-value ≤ 0.05 are plotted. (E) GO analysis for downregulated maternal transcripts. Top 12 terms in biological functions with P-value ≤ 0.05 are plotted. (F) qRT-PCR confirmation of differentially expressed maternal transcripts. Expression levels of genes that are upregulated (orange bars) or downregulated (blue bars) upon HP1a reduction were confirmed in a qRT-PCR experiment. Expression levels are shown as fold change over Cq values for Actin 5C, which did not show a significant level of differential expression upon HP1a reduction. Error bars indicate the mean Cq value ± SEM in three biological replicates. DE, differentially expressed; GO, gene ontology; qRT-PCR; quantitative RT-PCR; RNAi, RNA interference.

