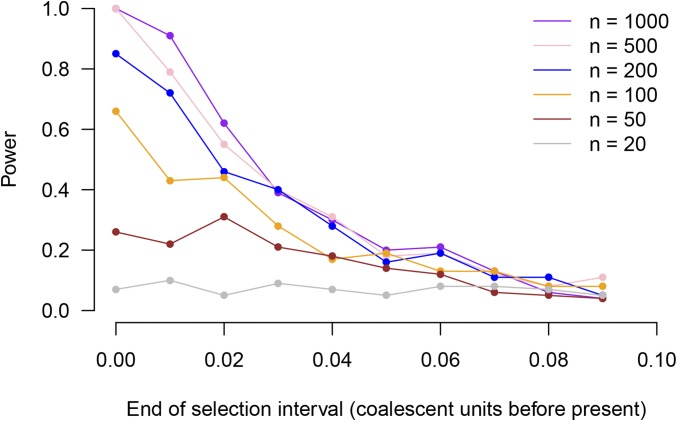
Figure 6.
Power of the test as a function of timing of selection and present-day sample size. Power is shown on the vertical axis. The horizontal axis shows the timing of a pulse of selection lasting 0.005 units and resulting in a shift in the population-average polygenic score of approximately one standard deviation (in present-day standard deviations). Each point is based on power from 100 simulations, using the proportion-of-lineages estimator on the true trees and using a null distribution obtained by randomly permuting locus effect sizes.

