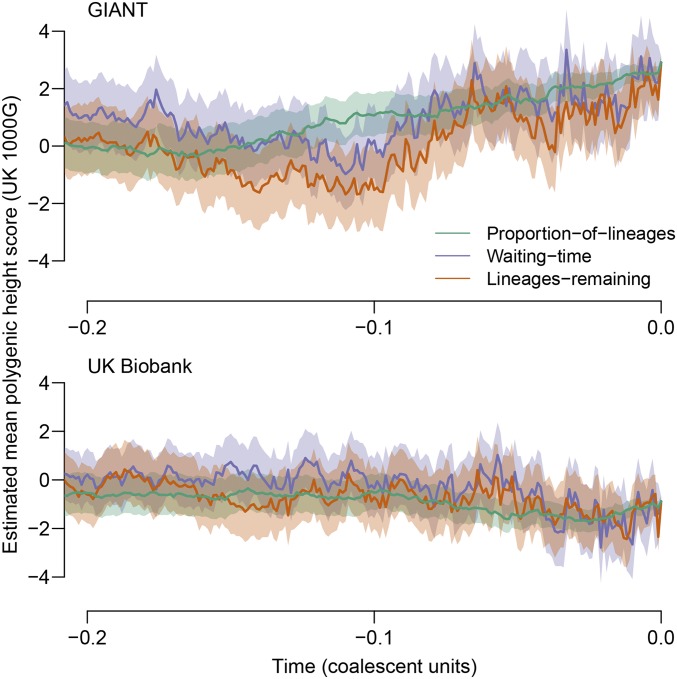
Figure 7.
Estimated population-mean polygenic scores for height in the population ancestral to the GBR subset of the 1000 Genomes Project (91 genomes). Time is displayed in approximate coalescent units, defined such that the mean across loci of the time (measured in mutations) to the most recent common ancestor is 2. To construct the polygenic scores, the top locus in each of approximately unlinked genomic regions was chosen. (See Appendix G for more information.) The top panel shows the results when effect sizes estimated by GIANT are used; the bottom panel shows analogous results when UK Biobank effect-size estimates are used. In both panels, the effect sizes are scaled so that the standard deviation of the polygenic score is 1 in the present, assuming linkage equilibrium among SNPs. 1000G, 1000 Genomes.

