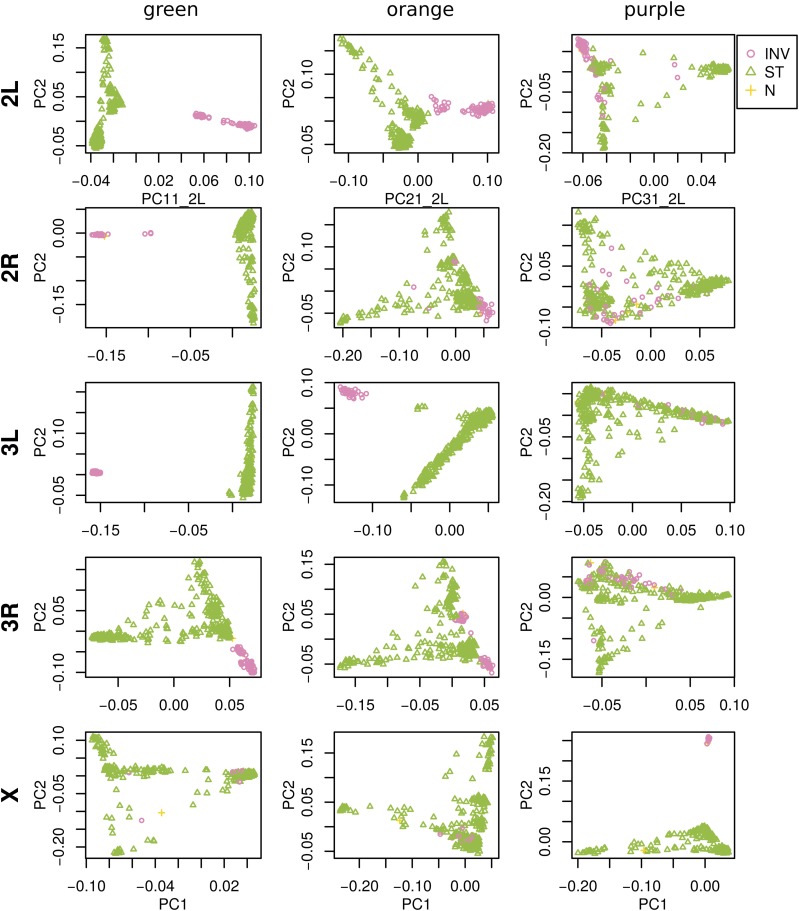
Figure 3.
PCA plots for the three sets of genomic windows colored in Figure 2, on each chromosome arm of D. melanogaster. In all plots, each point represents a sample. The first column shows the combined PCA plot for windows whose points are colored green in Figure 2; the second is for orange windows; and the third is for purple windows. In each, samples are colored by orientation of the polymorphic inversions In(2L)t, In(2R)NS, In(3L)OK, In(3R)K, and In(1)A, respectively [data from Lack et al. (2015)]. In each, “INV” denotes an inverted genotype, “ST” denotes the standard orientation, and “N” denotes unknown. PC, principal component; PCA, PC analysis.

