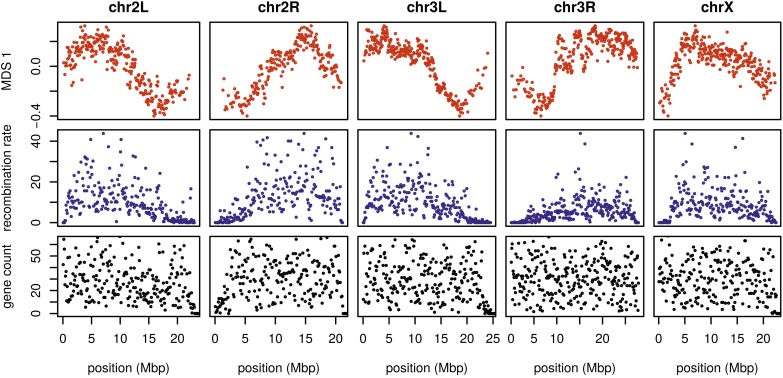
Figure 4.
The effects of population structure without inversions is correlated to recombination rate in D. melanogaster. The first plot (in red) shows the first MDS coordinate along the genome for windows of 10,000 SNPs, obtained after removing samples with inversions (a plot analogous to Figure 2 is shown in Figure S10). The second plot (in blue) shows local average recombination rates in cM/Mbp, obtained as midpoint estimates for 100-kbp windows from the Drosophila recombination rate calculator (Fiston-Lavier et al. 2010) release 5, using rates from Comeron et al. (2012). The third plot (in black) shows the number of genes’ transcription start and end sites within each 100-kbp window, divided by two. Transcription start and end sites were obtained from the RefGene table from the University of California Santa Cruz browser. The histone gene cluster on chromosome arm 2L is excluded. chr, chromosome; MDS, multidimensional scaling.

