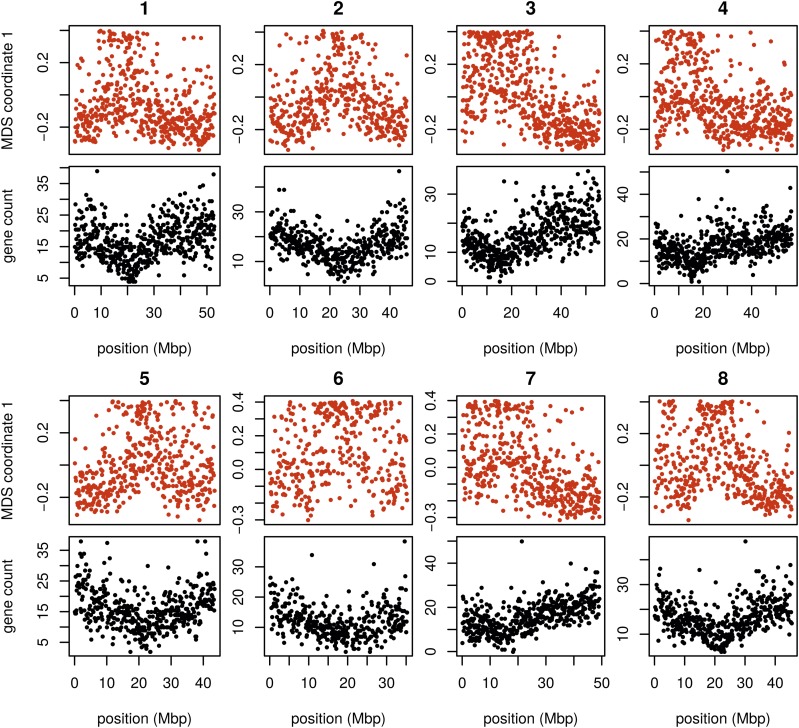
Figure 7.
MDS coordinate and gene density for each window in the Medicago genome, for chromosomes 1–8 (numbered above each pair of figures). For each chromosome, the red plot above is first coordinate of MDS against the middle position of each window along each chromosome. The black plot below is gene count for each window against the middle position of each window. MDS, multidimensional scaling.

