Figure 1.
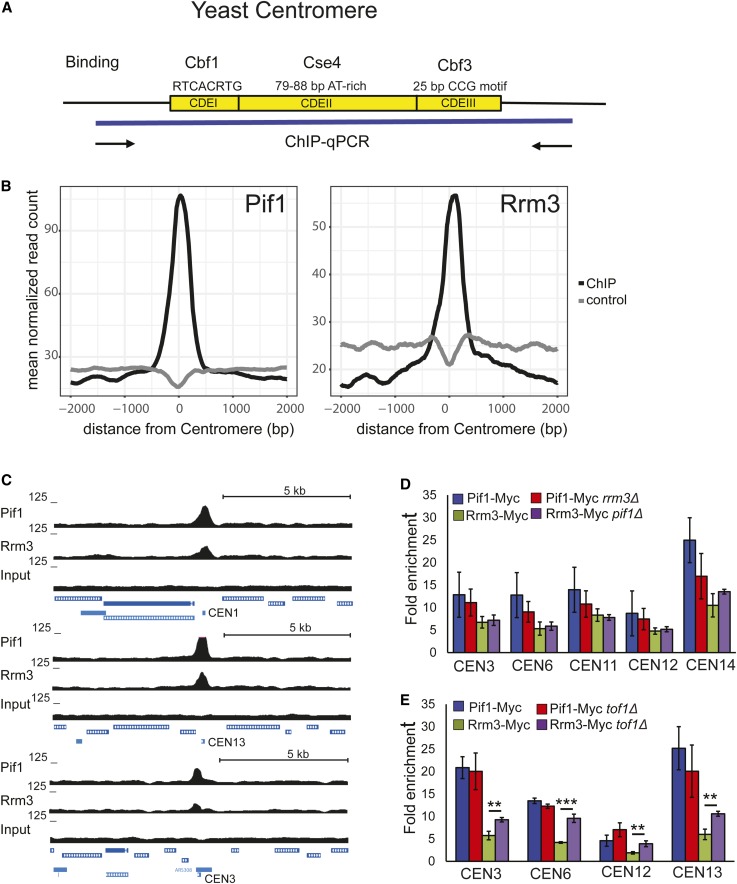
ScPif1 and Rrm3 helicases bind robustly to yeast centromeres. (A) Schematic of the three conserved elements in the ∼125-bp budding yeast centromere: (1) CDEI is 8-bp long; its consensus is RTCACRTG (R = purine); (2) CDEII is 78–86-bp long and is A+T-rich; and (3) CDEIII is 25-bp long; its consensus is (TGTTT(T/A)TGNTTTCCGAAANNNAAAAA), where N is any nucleotide (Biggins 2013). (B) Average normalized ScPif1 and Rrm3 ChIP-seq read counts are plotted at centromeric regions. Reads from matched input samples that were sheared but did not undergo the ChIP procedure were used as a control. (C) ChIP-seq signal for ScPif1 and Rrm3 (upper panel). Lower panels show ScPif1 and Rrm3 ChIP-seq read density at three centromeres (CEN1, CEN13, and CEN3). UCSC browser tracks were used to visualize ScPif1 binding and control reads (input). Data represent combined reads of three independent replicates. All data were normalized to 10 M reads per library. (D) Using Myc-tagged ScPif1 and Rrm3, ChIP-qPCR was carried out on three independent isolates of WT, pif1Δ, and rrm3Δ asynchronous cells grown at 30°. Binding to CEN3, 6, 11, 12, and 14 was normalized to binding to YBL028C, a control sequence that has low binding to both helicases (Tran et al. 2017). Fold enrichment is [(ChIP/Input)Target site/(ChIP/Input)YBL028C]. Blue bars, ScPif1 binding in WT cells; red bars, ScPif1 binding in rrm3Δ cells; green bars, Rrm3 binding in WT cells; purple bars, Rrm3 binding in pif1Δ cells. Here and elsewhere, error bars are ± SD, and P-values were obtained using an unpaired two-tailed Student’s t-test. In all figures, * P ≤ 0.05, ** P ≤ 0.01, *** P ≤ 0.001, and **** P ≤ 0.0001. (E) ChIP-qPCR was performed as described in (D), except that binding was determined in WT and tof1Δ cells. ChIP, chromatin immunoprecipitation; ChIP-seq, ChIP-sequencing; qPCR, quantitative PCR; UCSC, University of California Santa Cruz; WT, wild-type.

