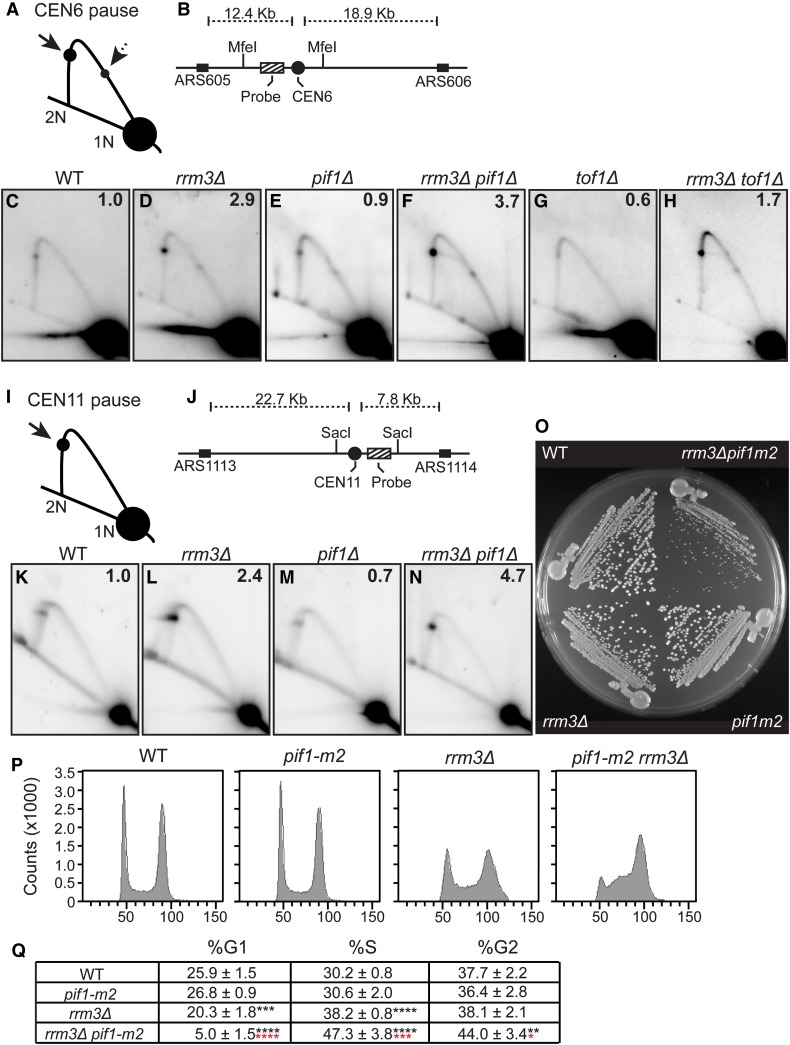
Figure 4.
ScPif1 promotes replication through centromeres but only in rrm3Δ cells. DNA from asynchronous WT and mutant cells was analyzed by 2D gel electrophoresis and Southern blot hybridization. (A) Schematic of 2D gel signal of MfeI-digested DNA using the probe indicated in (B) for the CEN6 fragment. Arrows mark the pauses at CEN6 along the arc of Y-shaped replication intermediates. The solid arrow indicates the pause produced from replication forks originating from ARS605. The dashed arrow indicates the pause arising from forks originating from ARS606. 1N indicates nonreplicating linear MfeI fragments. 2N indicates near fully replicated MfeI fragments. (B) Schematic of the MfeI fragment that contains CEN6 in relation to the flanking replication origins. Cross-hatch box indicates the position of the radiolabeled probe used for Southern blot analysis. (C–H) Southern blot analysis of 2D gels on CEN6 from cells with the following genotypes: (C) WT, (D) rrm3Δ, (E) pif1Δ, (F) rrm3Δ pif1Δ, (G) tof1Δ, and (H) rrm3Δ tof1Δ. (I) Same as (A) except that schematic is of CEN11 on a SacI fragment. (J) Same as (B) except that it shows CEN11 in relation to the flanking replication origins. (K–N) Southern blot of 2D gels from the following strains: (K) WT, (L) rrm3Δ, (M) pif1Δ, and (N) rrm3Δ pif1Δ. For both CEN6 and CEN11, the signal at the pause was quantified as in Tran et al. (2017) and normalized to the pause signal in WT cells to obtain the relative fold change. The average fold difference of mutant over WT from two or more independent biological replicates is shown in the upper right corner of each Southern blot. (O) Freshly dissected WT, pif1-m2, rrm3Δ, and pif1-m2 rrm3Δ spore clones derived from a multiply heterozygous but otherwise isogenic diploid were streaked on YEPD plate at 30° for 2 days. (P) Representative FACS profiles for one of five spore clones from WT, pif1-m2, rrm3Δ, and pif1-m2 rrm3Δ cells. (Q) Quantified FACs data from five independent biological replicates of each strain that were grown asynchronously at 30°. The percent of cells from each strain that are in G1, S, and G2 phase are indicated along with statistical significance relative to WT cells; indicated by black asterisks. Statistical significance of pif1-m2 rrm3Δ relative to rrm3Δ is indicated by red asterisks. * P ≤ 0.05, ** P ≤ 0.01, *** P ≤ 0.001, **** P ≤ 0.0001. 2D, two-dimensional; WT, wild-type; YEPD, YEP and dextrose.

