Figure 5.
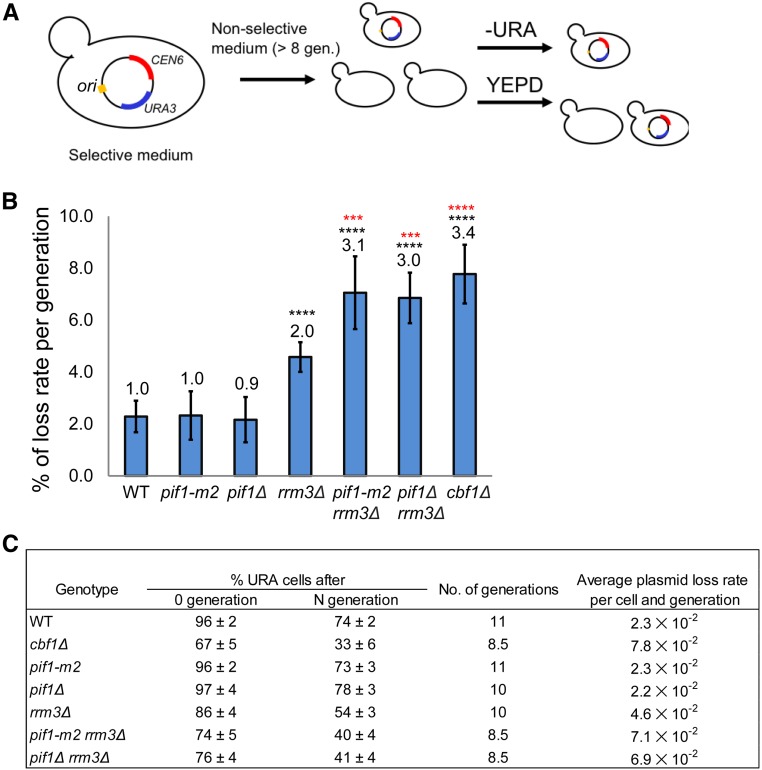
ScPif1 family helicases promote the segregation function of CEN6. (A) Schematic of CEN plasmid-loss assay. (B) Loss rate of CEN plasmid per generation in indicated strains. The loss rate in WT cells is defined as one and loss rates in mutant strains were normalized to this value. Means and SD of plasmid loss were obtained from a least three technical replicates of three different isolates per strain; *** P ≤ 0.001 and **** P ≤ 0.0001. Black asterisks indicate the significance of the loss rate in mutant vs. WT cells. Red asterisks indicate significance between the indicated mutant and rrm3Δ cells. (C) The table shows absolute plasmid loss rates in different strains. The average plasmid loss rate (R) is calculated per cell and number of generations. R = 1 − (F/I) l/N. I = the percentage of plasmid-containing cells at 0 generation. F = the percentage of plasmid-containing cells after N generations. WT, wild-type.

