Fig. 1.
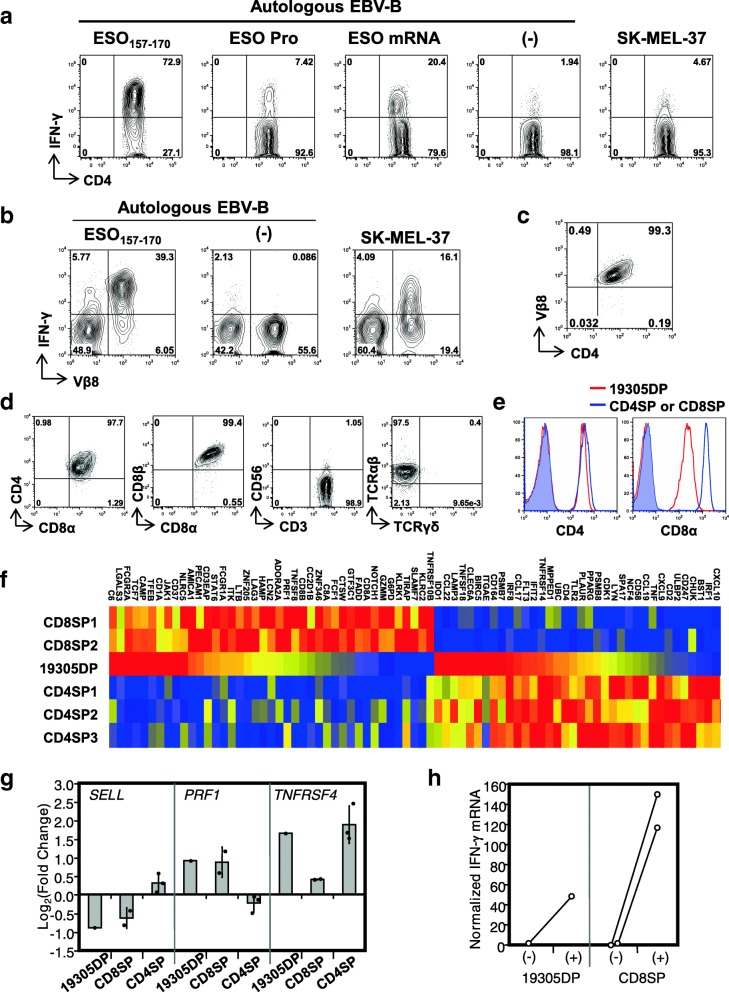
Characterization of NY-ESO-1-specific CD4+CD8+ T cells. a IFN-γ production by NY-ESO-1-specific CD4+ T-cell line was determined by intracellular cytokine staining following stimulation with NY-ESO-1157-170 peptide-pulsed, protein-pulsed, mRNA-electroporated or untreated (−) autologous EBV-transformed B cells (EBV-B), or SK-MEL-37. b IFN-γ production by SK-MEL-37-reactive CD4+ T-cell line was determined by flow cytometry. c Purification of CD4+Vβ8+ T cells was confirmed by flow cytometry. d Expression of cell surface molecules on 19305DP was determined by flow cytometry. e Expression of CD4 and CD8α on 19305DP was compared to those in CD4SP (left) and CD8SP (right) by flow cytometry. Shaded histograms indicate staining by isotype controls (mouse IgG2b for CD4 and mouse IgG1 for CD8α). f Gene expression in T-cell clones was investigated by Nanostring system. Expression of genes that were differently expressed in NY-ESO-1-specific CD8+ T-cell clones (CD8SP1 and 2) and NY-ESO-1-specific CD4+ T-cell clones (CD4SP1–3) in 19305DP without stimulation is shown as a heat map (red, yellow, and blue colors indicates strong, intermediate, and low expression, respectively). g Changes in mRNA expression following TCR stimulation was determined by Nanostring data. Columns and error bars for CD8SP and CD4SP indicate the means and the standard deviation. h Changes in IFN-γ mRNA levels with or without anti-CD3 stimulation in Nanostring data

