Figure 3.

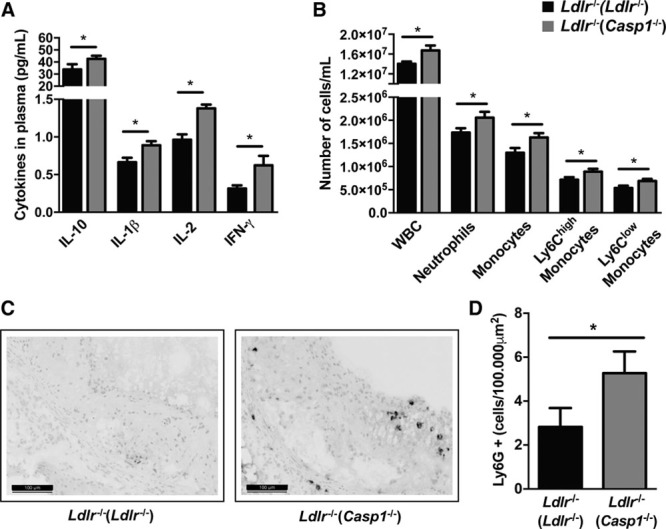
Casp1−/− dysbiosis leads to systemic inflammation. A, Plasma cytokines at time of sacrifice. n=10 per group. B, White blood cell (WBC) count and immune subsets during week 5 of cohousing. Ldlr−/−(Ldlr−/−) mice, n=18; Ldlr−/−(Casp1−/−) mice, n=17. C–D, Female Ldlr−/− mice aged 12 wk were exposed to fecal microbiota derived from Casp1−/− or Ldlr−/− mice for 13 wk while fed high-fat cholesterol (HFC) diet. C, Representative Ly6G-stained slides of the aortic root. Scale bars, 100 μm. D, Number of infiltrated neutrophils per 100.000 μm2 characterized by Ly6G-stained slides of the aortic root. Ldlr−/−(Ldlr−/−) mice, n=13; Ldlr−/−(Casp1−/−) mice, n=12. Data represent mean±SEM. *P<0.05 as determined by unpaired 1-tailed Student t test. IFN indicates interferon; and IL, interleukin.
