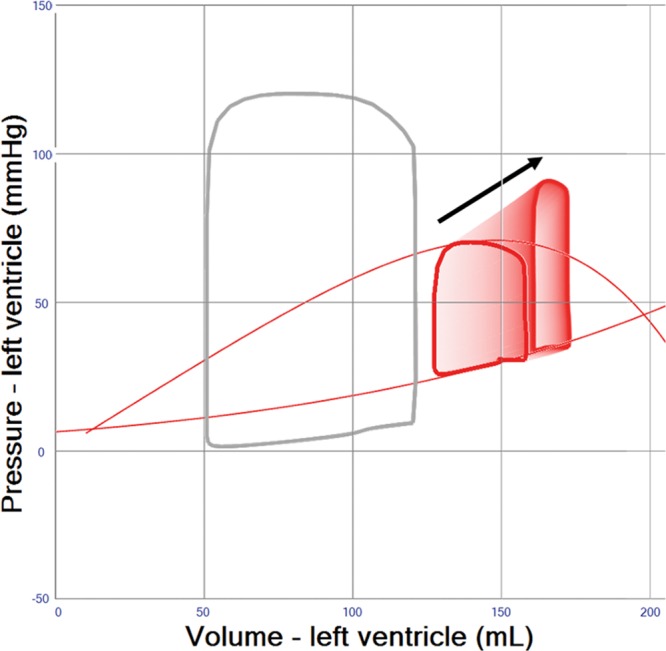
Figure 1.

Pressure–volume loop simulation of left ventricular (LV) failure. Normal physiology shown in gray loop for comparison. Red loop shows an LV with reduced systolic contractility, increase in passive LV diastolic stiffness and blood volume (see text) to mimic a clinical case of cardiogenic shock. Red thin lines indicate end-systolic and end-diastolic pressure–volume relations. The black arrow shows an increasing VA extracorporeal membrane oxygenation (ECMO) support 0–4 L/min with resulting decrease in stroke volume and dilatation of the LV.
