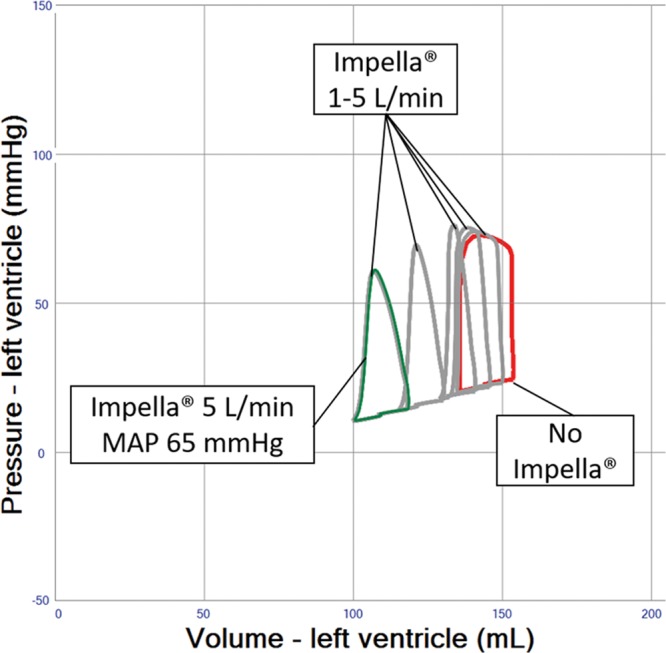
Figure 6.

Pressure–volume loop analysis of Impella effects in left ventricular systolic failure and veno-arterial extracorporeal membrane oxygenation (VA ECMO) 4 L/min. Device flows of 1–5 L/min are shown in gray loops. Systemic vascular resistance is finally readjusted down to systemic mean arterial blood pressure (MAP) 65 mm Hg, resulting in further unloading as indicated in the green loop.
