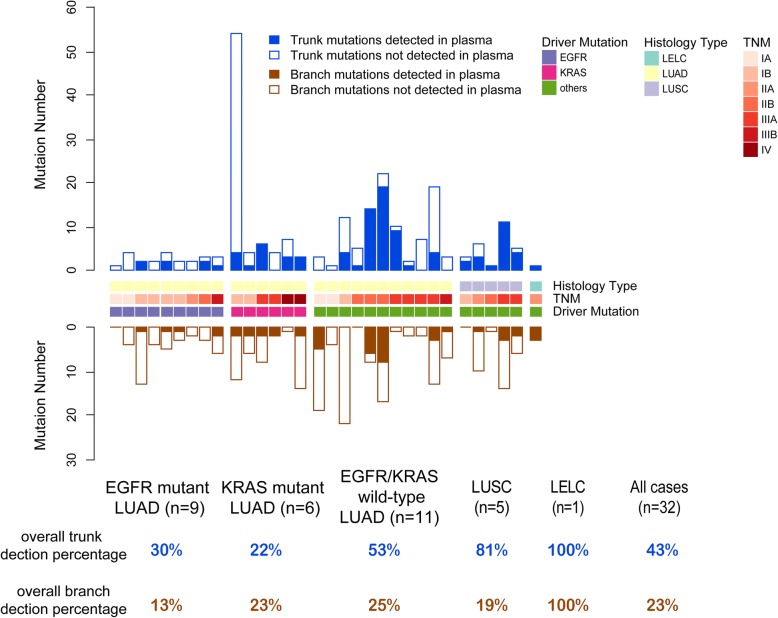
Fig. 2.
Tumor-derived mutations by ctDNA sequencing.The designations between the two bar charts showed histology type, typical mutant driver genes, and TNM stage of each patient. The table at the bottom of panel describes the overall trunk or branch mutation detection percentage in different subtypes of NSCLC

