
Fig. 4.
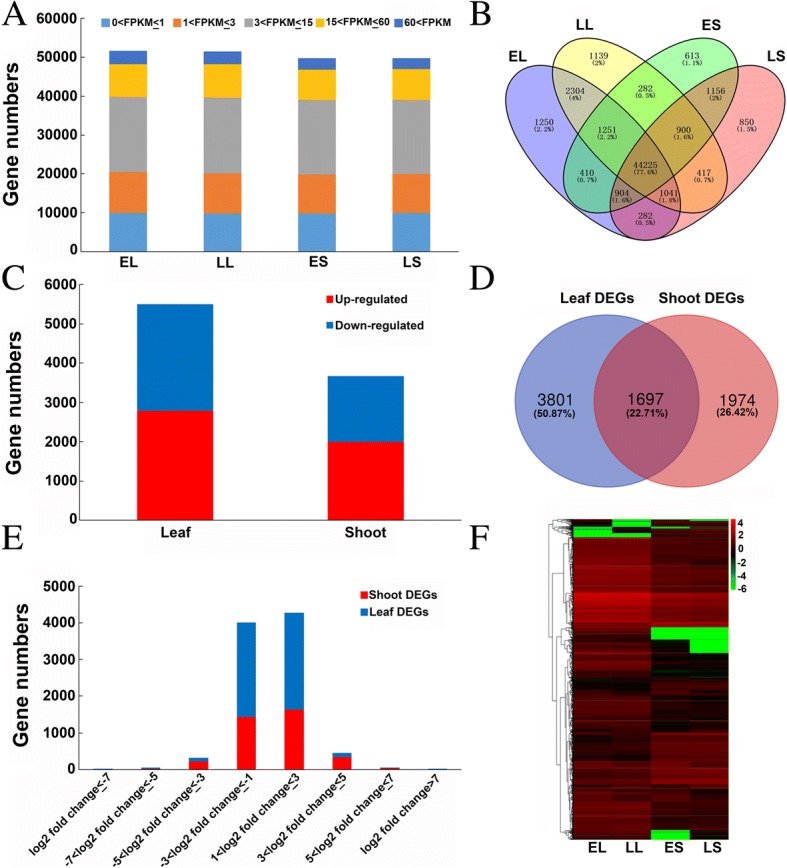
Gene expression profiles and DEGs identified between early- and late-flowering bulks. a Statistical analysis of data from the four samples, i.e. early- and late-flowering bulks in leaf and shoot tissues: b Venn diagram of the number of genes detected in the four samples. c Identification of DEGs in leaf and shoot tissues between early- and late-flowering bulks. d Venn diagram of DEGs in leaf and shoot tissues. e Fold changes in the expression of DEGs detected between early- and late-flowering bulks in leaf and shoot tissues, respectively. f Heat map of gene expression levels in the four samples. Fold change: FPKM early/FPKM late