
Fig. 8.
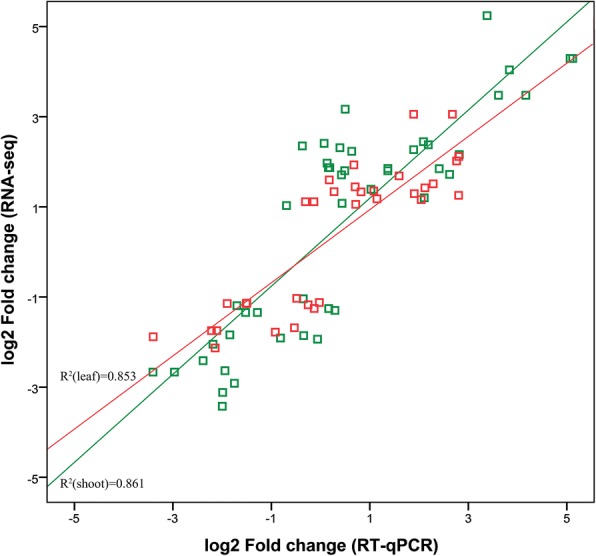
qRT-PCR validation of the expression patterns of 47 randomly selected DEGs identified by transcriptome sequencing. Red and green lines indicate regression lines for leaves and shoots, respectively
Official websites use .gov
A
.gov website belongs to an official
government organization in the United States.
Secure .gov websites use HTTPS
A lock (
) or https:// means you've safely
connected to the .gov website. Share sensitive
information only on official, secure websites.
qRT-PCR validation of the expression patterns of 47 randomly selected DEGs identified by transcriptome sequencing. Red and green lines indicate regression lines for leaves and shoots, respectively