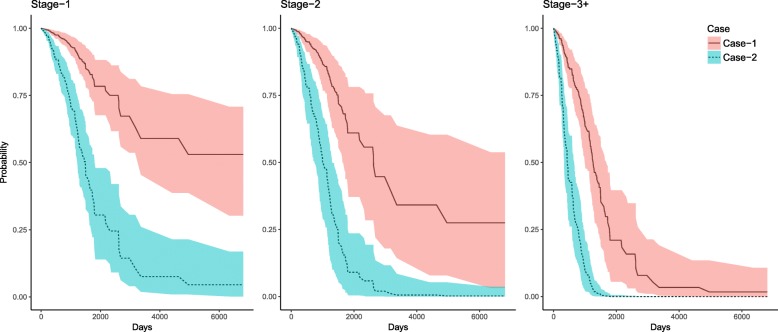
Fig. 2.
Survival functions estimated for two hypothetical individuals of age 60 with miRNA profiles represent by SXCase − 1 and SXCase − 2, for given pathological state s, s∈{State-1, State-2, State 3+}. Four miRNAs: miR-375, miR-326, miR-181c-5p, and miR-99a-5p, are upregulated in Case-1, but downregulated in Case-2. miR-582-3p is downregulated in Case-1, but upregulated in Case-2. Survival functions are displayed for s = Stage-1, s = Stage-2, and s = Stage = 3+, scenarios. The colored region represents 95% bootstrap based point-wise CIs

