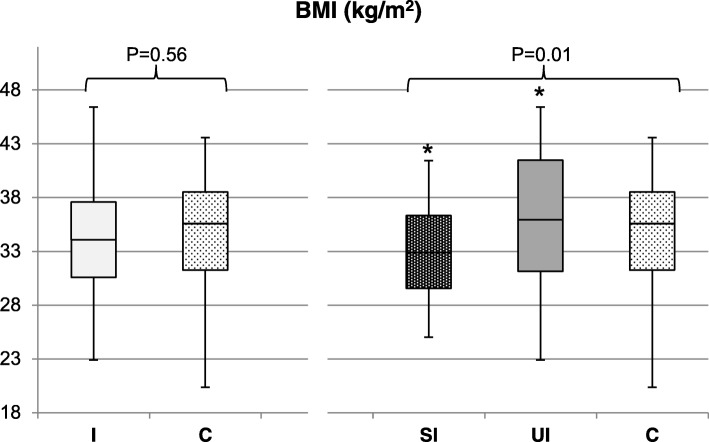
Fig. 3.
Differences in self-reported BMI (kg/m2) at follow-up. Differences between women allocated to the intervention group (I; N = 84) versus the control group (C; N = 95) were analysed using multivariate linear regression, corrected for: Caucasian origin (yes/no), education level (categorical: no education or primary school; secondary education; intermediate vocational education; higher vocational education and university), smoking (yes/no) and duration of infertility (months). Differences among women who successfully lost weight during the intervention (SI; N = 45), who were unsuccessful in losing weight (UI; N = 33) and the control group (C; N = 95) were analysed using ANCOVA, corrected for the previously mentioned covariates. Tukey post-hoc tests were used to analyse differences within groups. Mean BMI and SD: I = 34.4 kg/m2 (5.1); C = 34.5 kg/m2 (5.0); SI = 32.9 kg/m2 (4.0); UI = 36.2 kg/m2 (6.0); C = 34.5 kg/m2 (5.0). *P-value = 0.01

