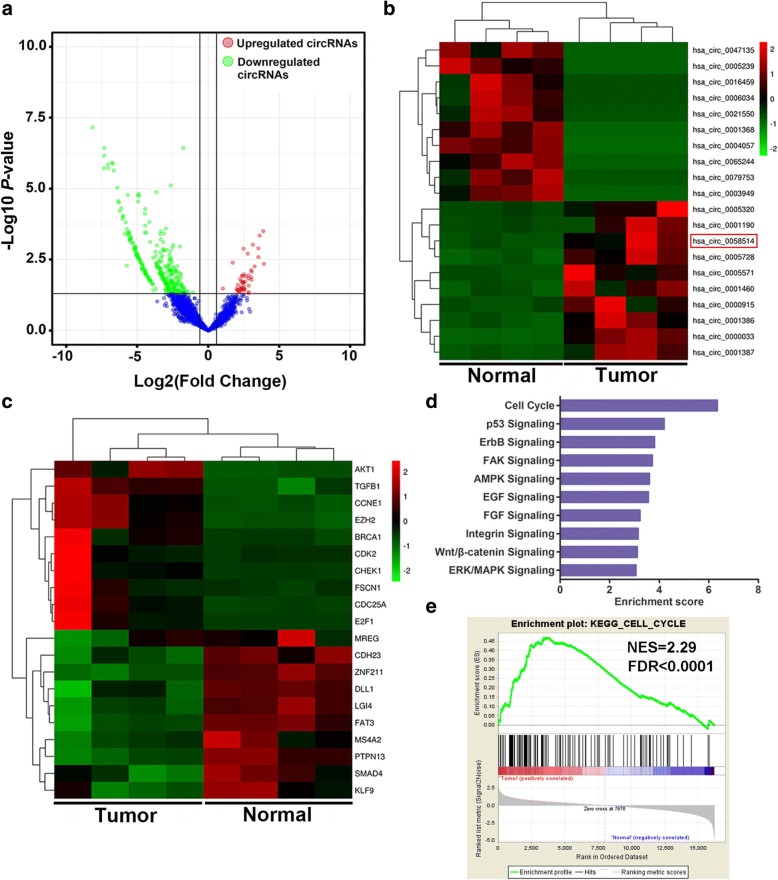
Fig. 1.
Expression profiles of circRNA and mRNA in TNBC. a The volcano plot visualizes the expression of circRNA between TNBC tissues and adjacent non-tumor tissues. The red dots and green dots represent upregulated and downregulated circRNAs with statistical significance, respectively. b and c The cluster heat maps displayed the 10 most increased and decreased circRNAs and representative differentially expressed mRNAs. Each column indicates a sample while each row indicates an individual circRNA or mRNA. The red and green strips represent high and low expression, respectively. d KEGG pathway analysis of differentially expressed mRNAs. e GSEA was performed in KEGG gene sets

