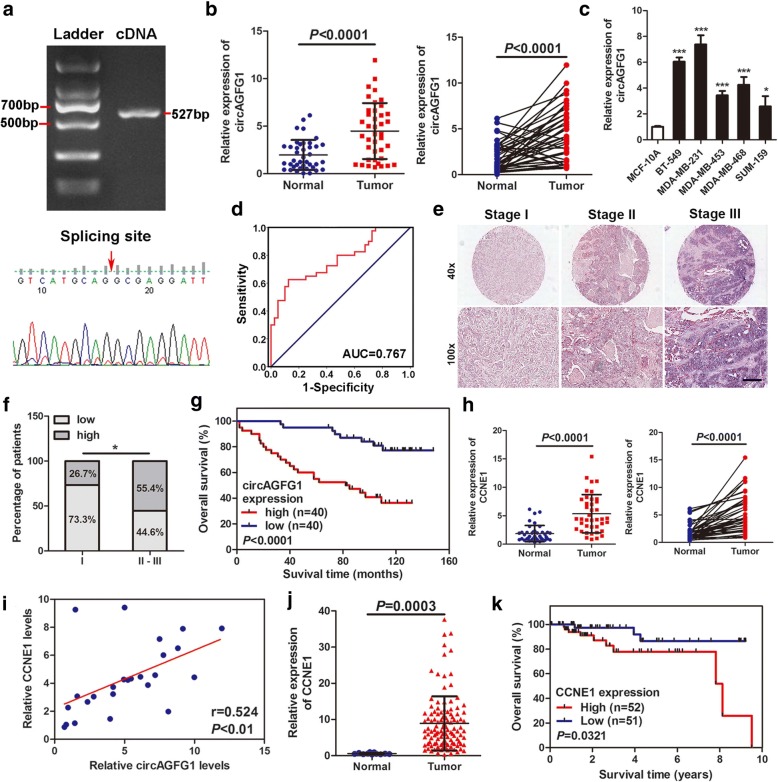
Fig. 2.
circAGFG1 and CCNE1 are up-regulated in TNBC and associated with the progression and poor prognosis. a PCR product of circAGFG1 in agarose gelelectrophoresis and the splicing site verified by DNA sequencing. b Relative expression of circAGFG1 in TNBC tissues (Tumor) and adjacent non-tumor tissues (Normal) was detected by qRT-PCR (n = 40). c Relative expression of circAGFG1 in cell lines was determined by qRT-PCR. d Diagnostic value of circAGFG1 for TNBC was evaluated by ROC curve. e Representative images of circAGFG1 expression in TNBC tissues were detected by ISH assays. Scale bar, 100 μm. f Percentages of specimen with low or high expression of circAGFG1 according to TNM stage. g Kaplan-Meier survival curve of overall survival in 80 patients with TNBC according to the circAGFG1 expression. Patients were stratified into high expression and low expression group by median expression. h Relative expression of CCNE1 in TNBC tissues (Tumor) and adjacent non-tumor tissues (Normal) was detected by qRT-PCR (n = 40). i Pearson correlation analysis of circAGFG1 and CCNE1 expression in 20 TNBC tissues. j Relative expression of CCNE1 in TNBC tissues (Tumor) compared with normal tissues (Normal) was analyzed using TCGA data. k Kaplan-Meier survival analysis of overall survival based on TCGA data (n = 103). Data were showed as mean ± SD, *P < 0.05, ***P < 0.001

