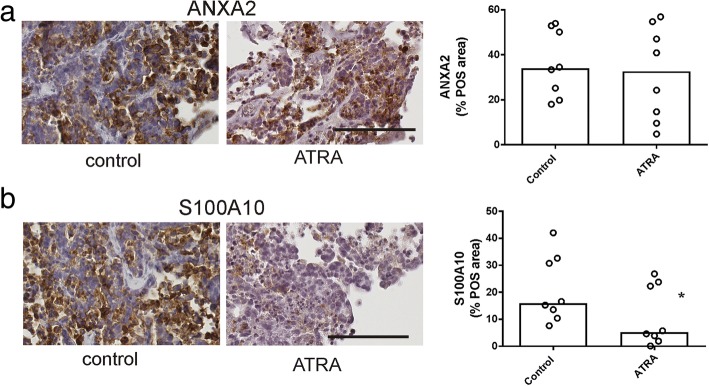
Fig. 7.
The effect of ATRA treatment on annexin A2 and S100A10 protein levels in ex vivo tissue explants. High grade serous ovarian cancer tissues were treated with control medium (0.1% DMSO) or ATRA (1 μM) for 72 h (n = 8). Representative images for annexin A2 (a) and S100A10 (b) immunostaining are shown (scale bar = 100 μm, all images are the same magnification). The summary of the annexin A2 and S100A10 immunostaining quantitation for 8 patients are shown. The data represents the area of annexin A2 or S100A10 positivity measured by video image analysis (% positive area). The bar is the median value. *p < 0.05, Wilcoxon pair test

