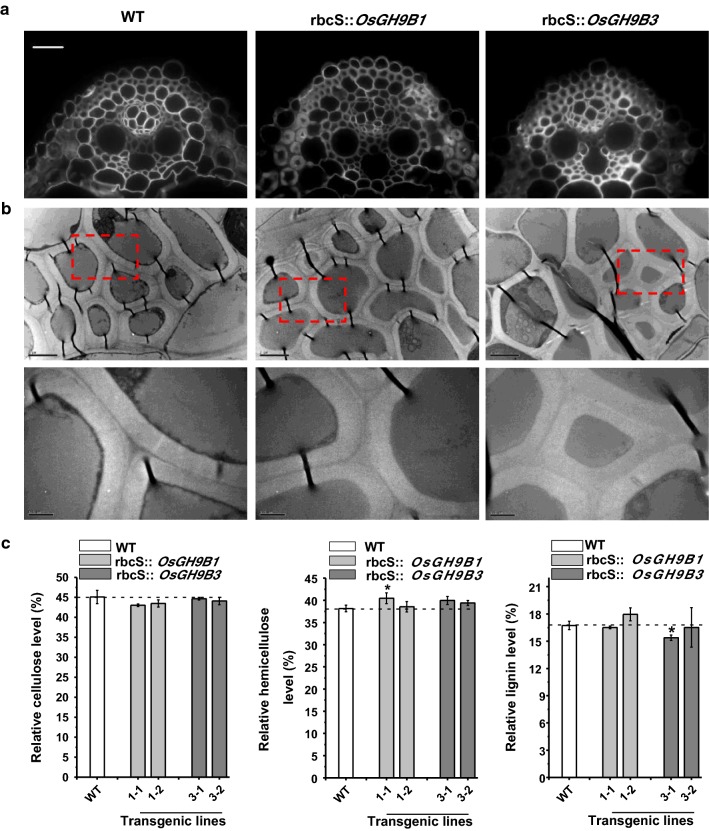
Fig. 6.
Cell wall morphologies and compositions in the OsGH9B1 and OsGH9B3 transgenic lines. a Sclerenchyma cells with Calcofluor White staining observed under a fluorescence microscopy, scale bar as 50 μm. b Cell walls morphology of sclerenchyma cells under transmission electron microscopy, scale bar as 2 μm (up) and 0.5 μm (down). c The contents of three major cell wall polymers (% total). Student’s t test performed for WT and transgenic plants as *p < 0.05

