Fig. 8.

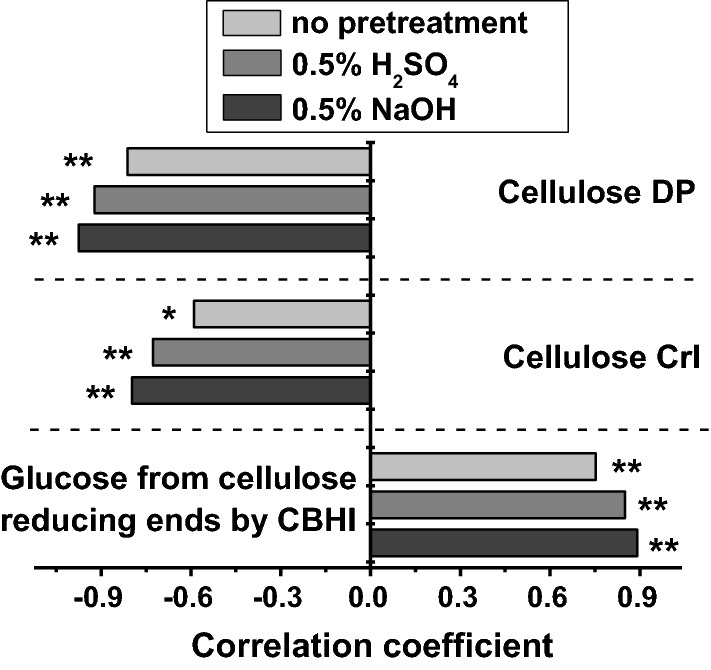
Correlation analysis between enzymatic saccharification and cellulose features. * and ** Indicate the significant differences at p < 0.05 and p < 0.01, respectively (n = 15)

Correlation analysis between enzymatic saccharification and cellulose features. * and ** Indicate the significant differences at p < 0.05 and p < 0.01, respectively (n = 15)