Fig. 4.
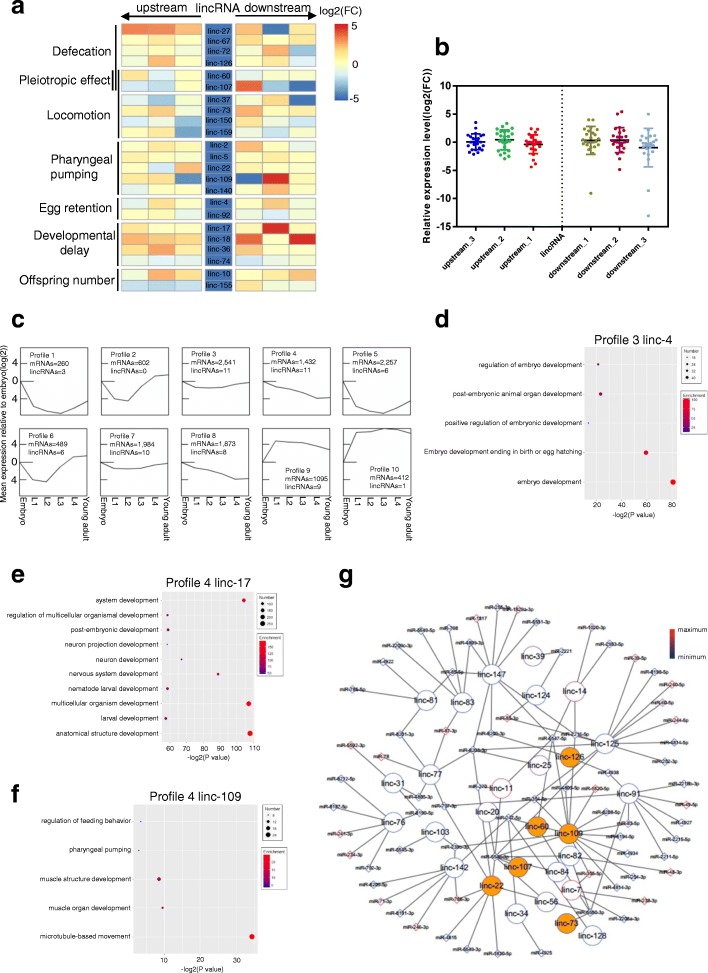
Connections of lincRNAs to mRNAs and microRNAs. a Heatmap of the expression levels of lincRNA-neighboring genes in lincRNA mutants. The expression level of each gene was assessed by qRT-PCR, and log2(FC) compared to wild type in gene expression was converted to heatmap (FC, fold change). Forward and backward arrows indicate the downstream and upstream genes. Log2(FC) were set between − 5 and 5 mandatorily to draw the heat map. b Relative expression levels of neighboring genes of the 23 lincRNAs with mutant phenotypes; data are the same as in a, except that the Log2(FC) are actual values. c Mean expression profiles of mRNAs and lincRNAs using our RNA-seq data from six developmental stages (embryo, L1, L2, L3, L4, young adult). Data were analyzed by Short Time-series Expression Miner (STEM) [24] using k-means clustering. Signals for each profile cluster were normalized to signals of the embryonic stage. d GO analysis of coding genes in profile 3 for ontology matching the linc-4 phenotype of egg retention. e GO analysis of protein coding genes in profile 4 for ontology matching the linc-17 phenotype of developmental delay. f GO analysis of protein-coding genes in profile 4 for ontology matching the linc-109 phenotype of pharyngeal pumping. g Global network of the lincRNA-miRNA interaction constructed with our RNA-seq data for long RNAs and microRNAs from nine developmental stages and worm populations. LincRNAs in golden brown-filled circles represent lincRNAs with mutant phenotypes in this study. The line colors of the circle (for lincRNA) and diamond (for miRNA) represent relative expression levels (scale shown to the right)

