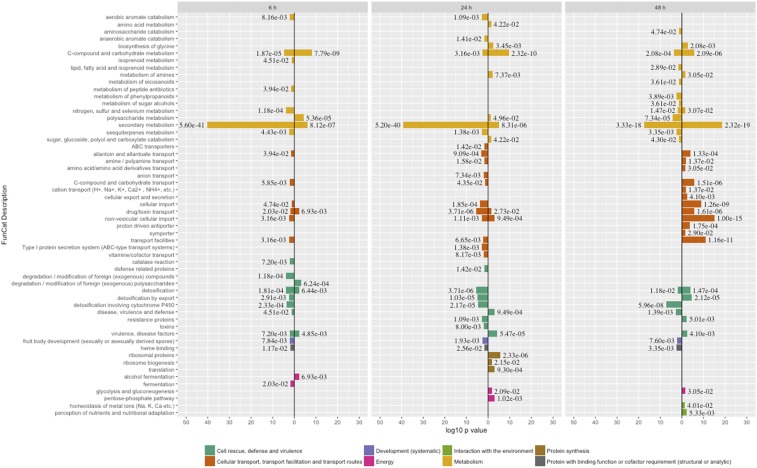
Figure 4.
- FunCat terms associated with DEGs found in vs. Control at 6 h, 24 h, and 48 h. The minus log10 of the p-value of DEGs in each term is proportional to the length of the bars. FunCat annotations and p-value as determined by FungiFun2(https://elbe.hki-jena.de/fungifun/fungifun.php): (i) metabolism is shown in orange, (ii) cellular transport, transport facilities and transport routes in light brown, (iii) cell rescue, defense & virulence in dark green, (iv) development in purple, (v) protein with binding function or cofactor requirement (structural or analytic) in black, (vi) protein synthesis in dark brown, (vii) energy in magenta, and (viii) interaction with the environment in light green. Down regulated genes are to the left of the origin and up regulated to the right.

