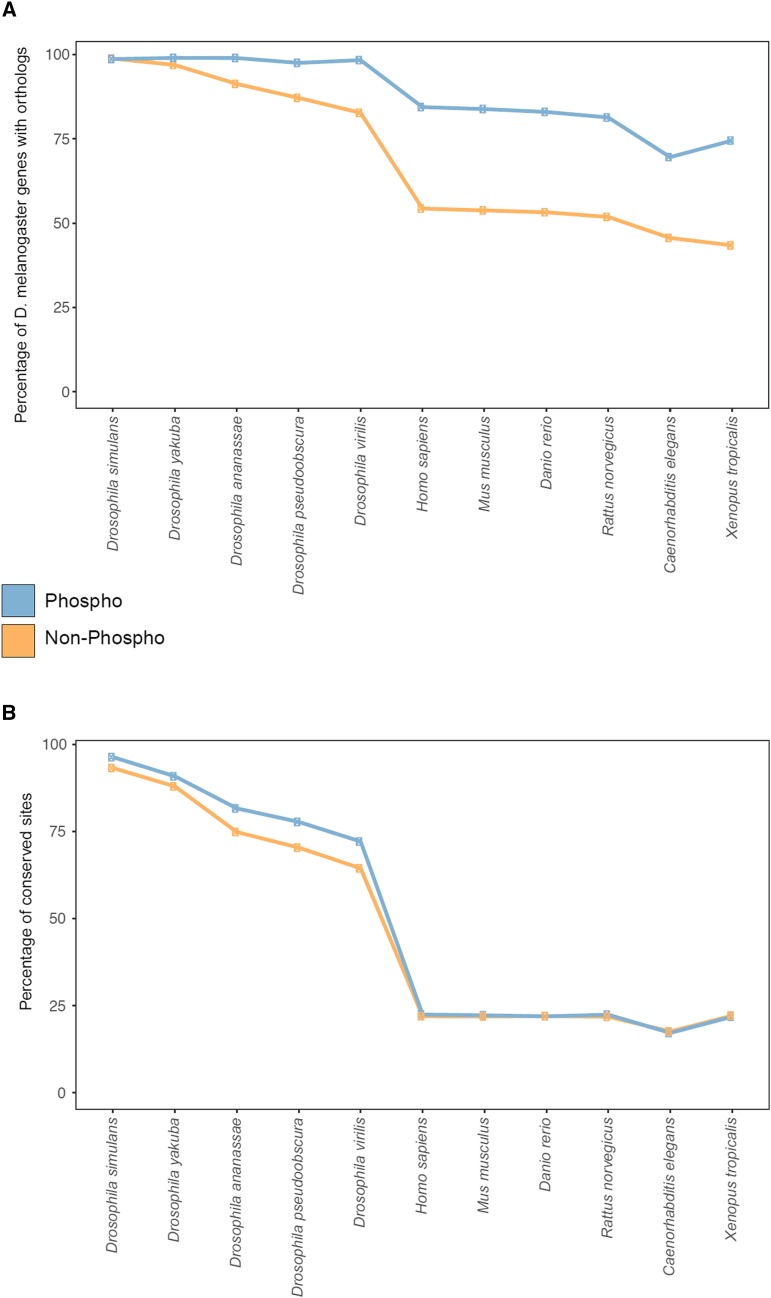
Figure 4.
Conservation of phosphorylated proteins and sites. The line plot illustrates the proportions of Drosophila melanogaster phosphoproteins (blue) and non-phosphoproteins (orange) showing orthologs in other species (A). The line plot shows the proportions of conserved Drosophila melanogaster phosphosites (blue) and non-phosphorylated serines, threonines, and tyrosines (orange) across species (B).

