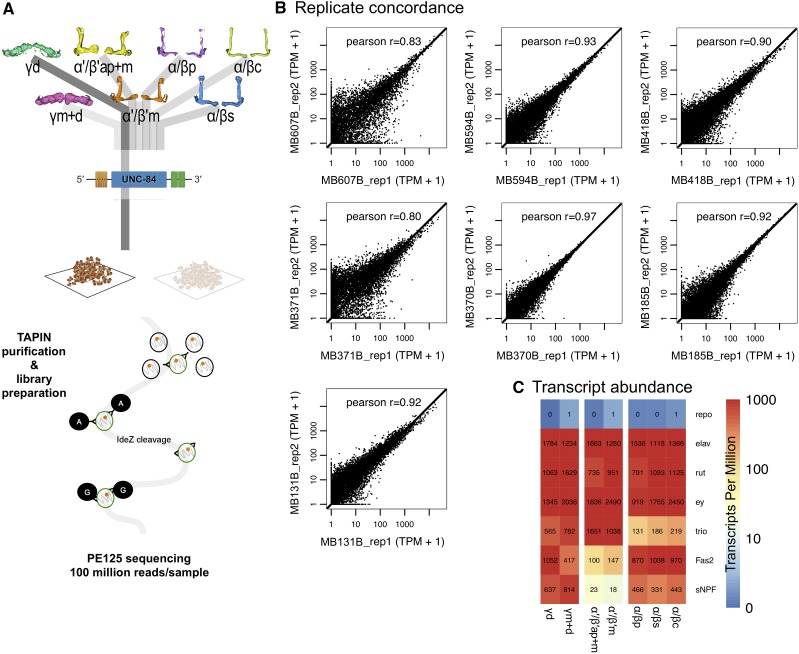
Figure 2.
TAPIN-seq profiling of MB subtypes. (A) Driver lines expressing in the seven Kenyon cell subtypes were crossed with the TAPIN-seq reporter, which labels the nuclei in each subtype. Nuclear RNA from each subtype was used to generate RNA-seq libraries, which were sequenced in paired-end mode. (B) We estimated reproducibility of the TAPIN-seq measurements by calculating the Pearson correlation between estimated transcript abundances (log2 transformed Transcripts Per Million + 1). (C) The TAPIN-seq transcriptomes recover the neuronal marker elav, while not detecting the glial marker repo. The transcriptomes also recover the expected expression patterns of the known pan-Kenyon cell markers ey and rut as well as class-enriched genes trio, Fas2, and sNPF.

